• Menu
  • Skip to primary navigation
  • Skip to main content
  • Skip to primary sidebar

cothrive.earth

  • Home
  • About
  • Blog
  • Essays
  • Subscribe
  • Donate
  • Contact
  • Home
  • About
  • Blog
  • Essays
  • Subscribe
  • Donate
  • Contact

Blog

Ridiculouser and Ridiculouser

November 23, 2023 By //  by cothrivejs

Hello, and Happy Thanksgiving!

If, hypothetically, one were a data geek, this time of year would bring anticipation for not just the holidays, but also the release of two indispensable economic data sets. Both look at every American county, allowing for comparisons between Teton County and the rest of the country.

In a few weeks, the Internal Revenue Service (IRS) will release information based on 2021’s tax returns. Last week, the Bureau of Economic Analysis (BEA) released its own set of income- and jobs-related data. These data reflect actual information from 2021, and the BEA’s estimates for 2022.

Here’s the punchline.

According to November 16’s BEA data:

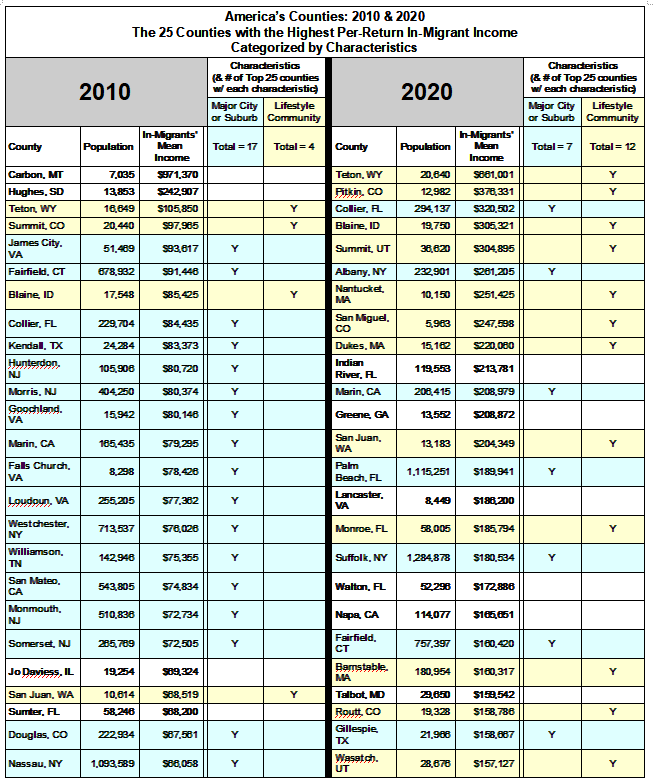
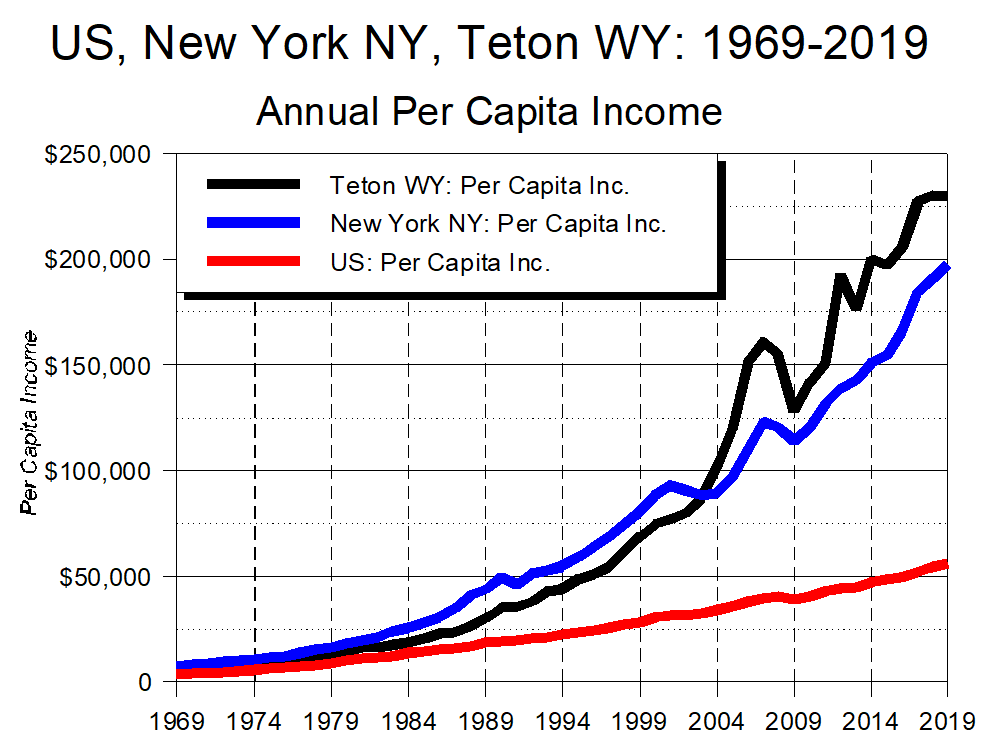
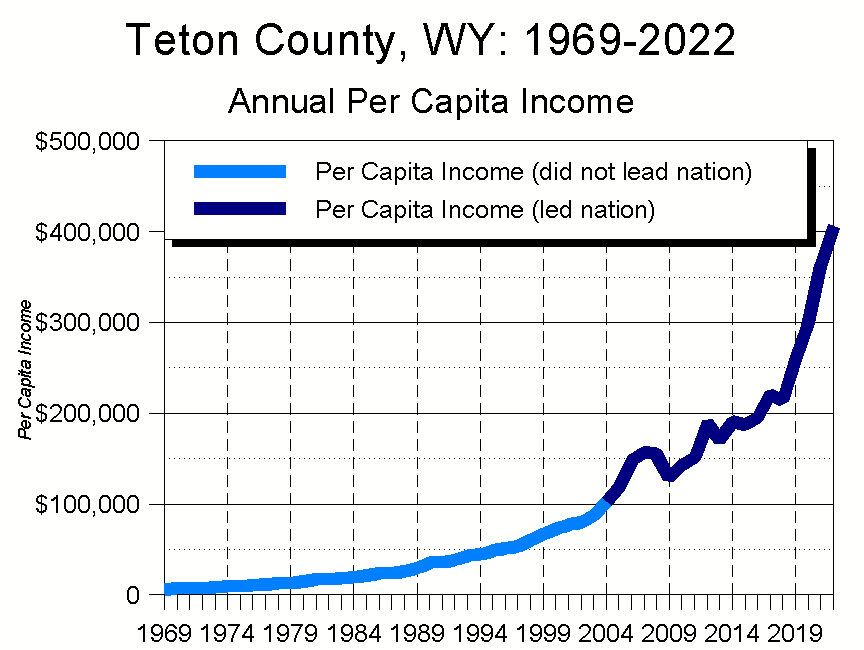
  • In 2017, Teton County, WY became the first county in the nation’s history to record a per capita income of more than $200,000 – to be precise, $220,415
    • That year, the US figure was $51,004, 23% of Teton’s
  • In 2020, Teton County, WY became the first county in the nation’s history to record a per capita income of more than $300,000 – $300,665
    • The US figure was $59,153, 20% of Teton’s
  • In 2022, the BEA estimates that Teton County WY became the first county in the nation’s history to record a per capita income of more than $400,000 – $406,054
    • The US figure was $65,470, 16% of Teton’s

Ponder that for a moment. Last year, every one of Teton County’s 23,287 residents had a mean income of $406,054, more than six times that of the typical American. To an even greater degree than has been true in the past, on a per capita basis Teton County, Wyoming is the wealthiest county in the wealthiest country in the history of the world.

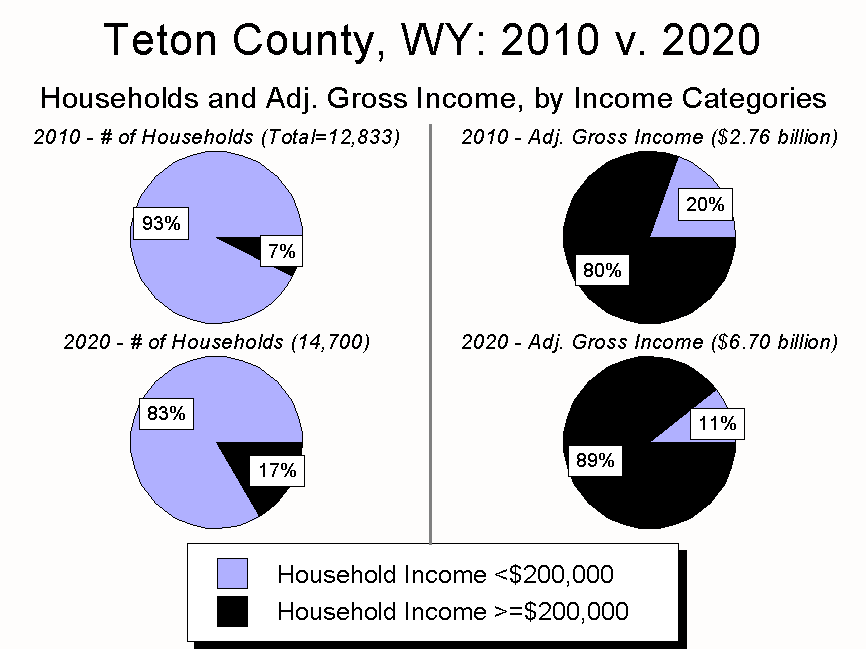
Making things even more surreal is the pace at which change has occurred. In 2016, Teton County’s population was 23,157 and its residents’ total income was $4.53 billion. Six years later, the population was essentially the same – 23,287 – but residents’ total income had doubled, to $9.46 billion. In comparison, for the nation as a whole, income increased by one-third.

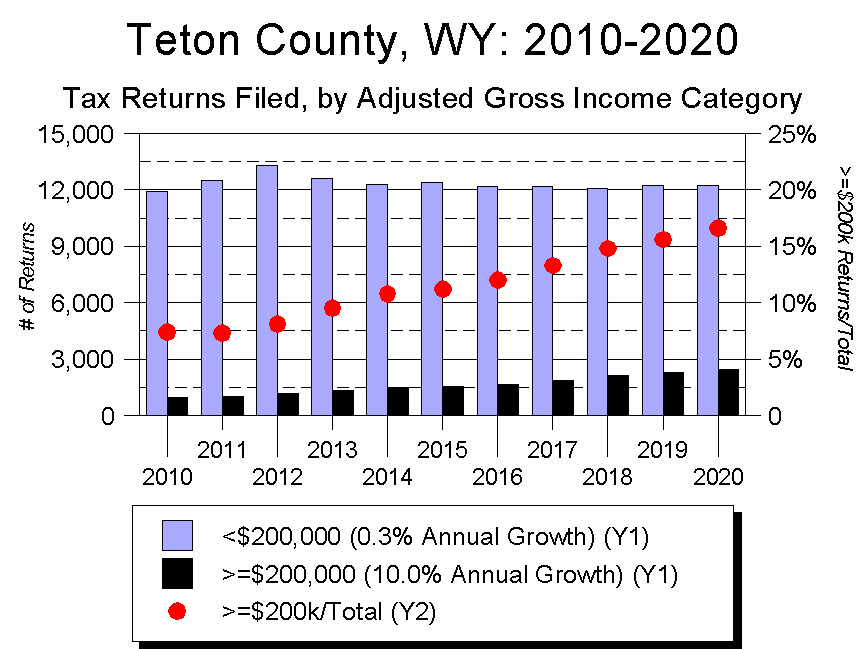
To say such growth and change is whiplash-inducing dramatically understates the case. Especially because it’s almost certain the growth has not been equally distributed. Equally likely is that while the overall population hasn’t changed much during that time, its composition has, with new, higher-income residents displacing longer-term lower-income folks.

The fact that COVID occurred in the middle of this transformation hints at how the forces unleashed by the pandemic are shaping Teton County’s present and future. What really interests me, though, is that the same forces changing Jackson Hole are also unmooring every desirable place to live worldwide. The same phenomena are occurring all over the place; they’re just easier to see in the Tetons.

  • Income: The Mind Boggles
  • Jobs: The Rise of Finance & Professional Services
  • Growth and Change
  • Conclusion

The essay below dissects the BEA’s numbers. I’ll do another, similar analysis when the IRS figures are released, for they will allow me to examine how widely distributed Teton County’s income growth has been.

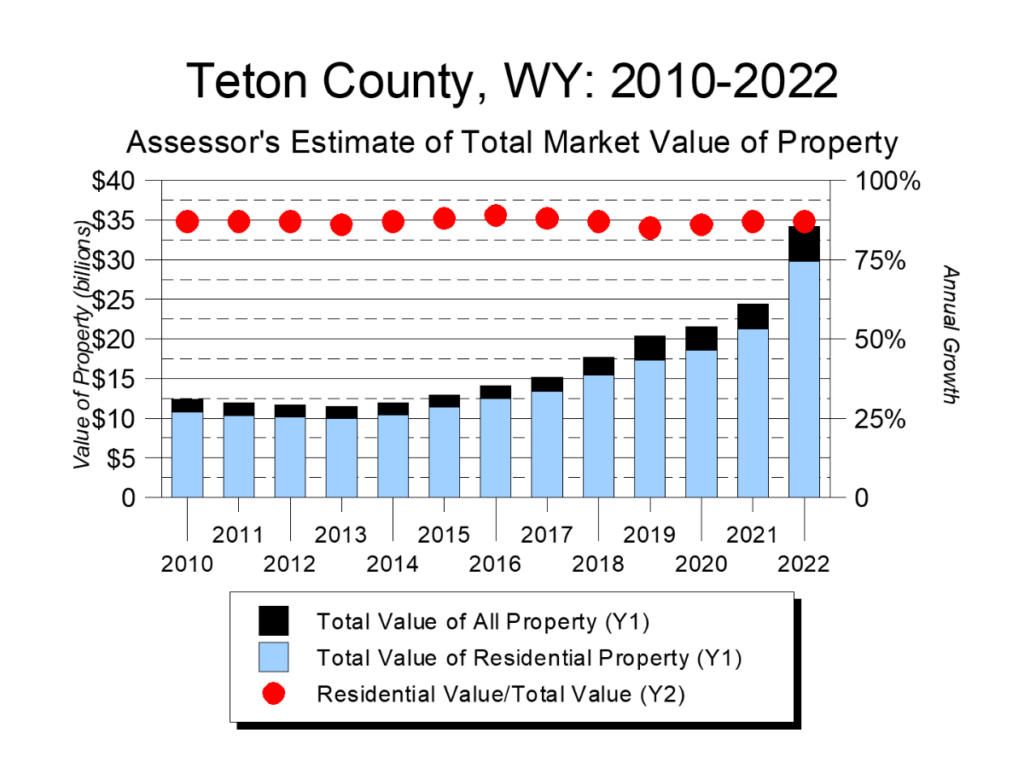
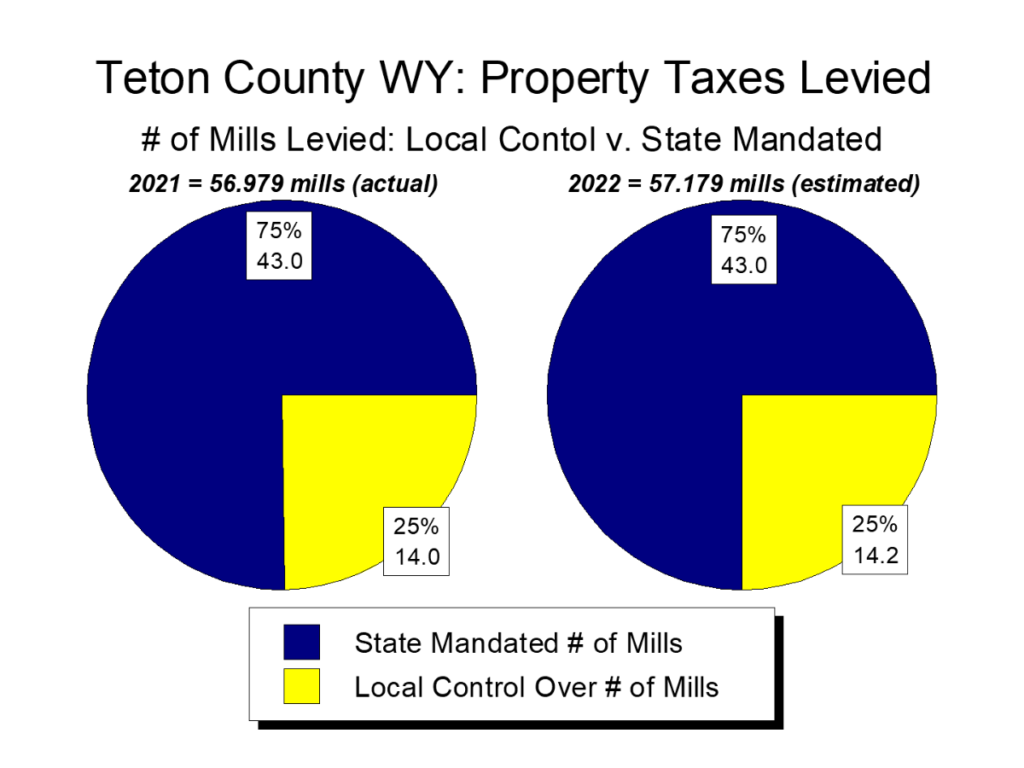
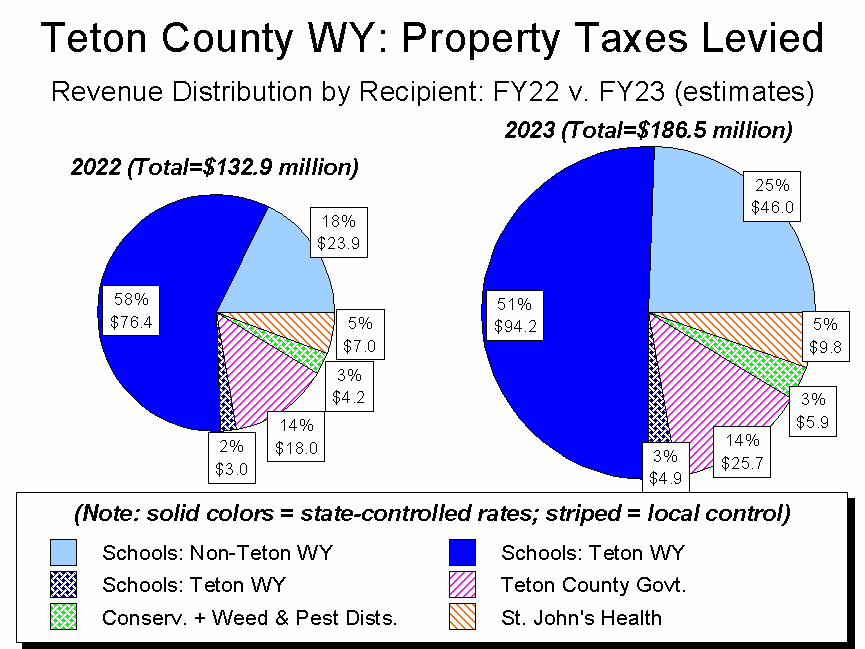
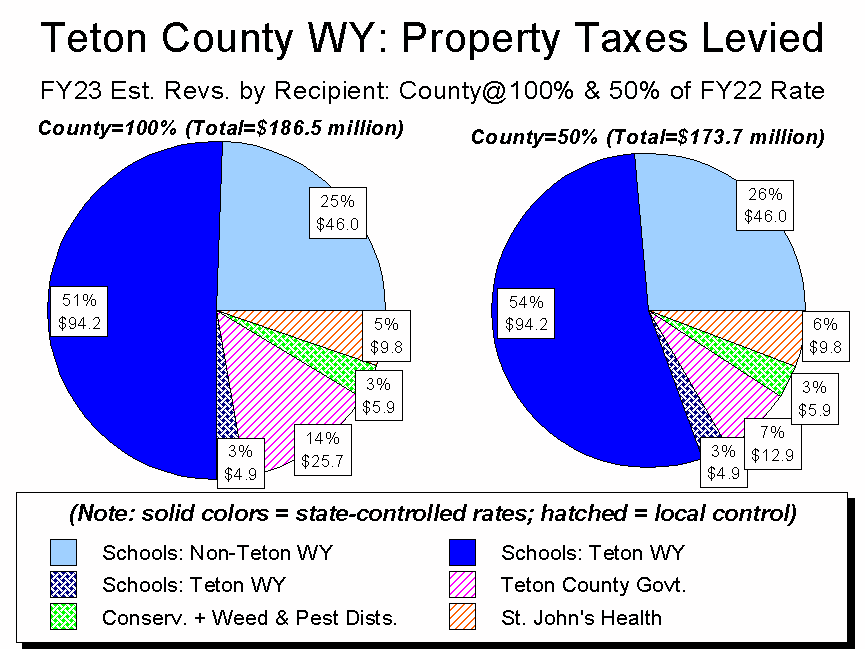
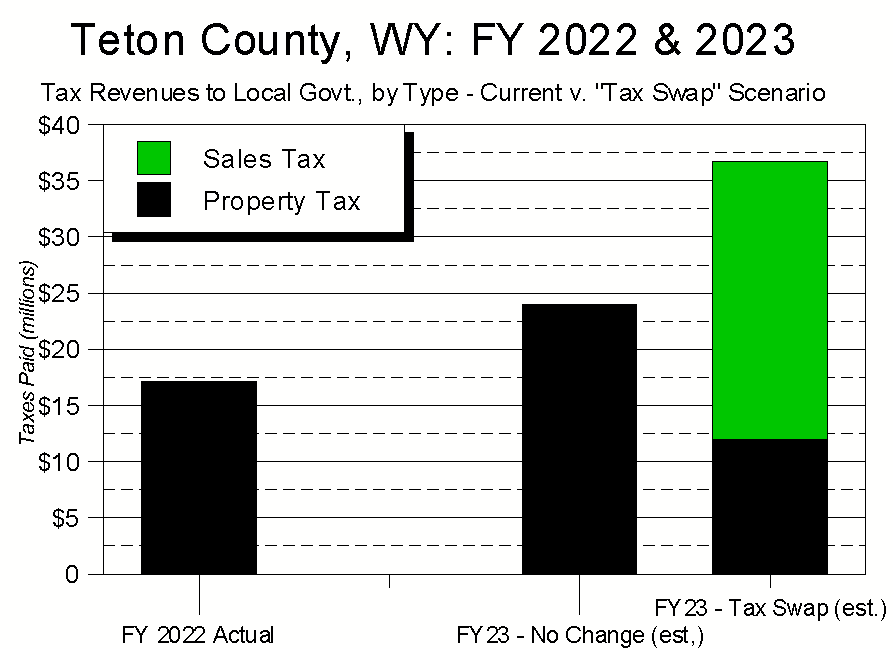
To further telegraph my punches, I’ve also been looking into Teton County’s dramatic rise in property taxes. Look for a newsletter on that subject post-Thanksgiving.

During this season of gratitude, please accept my deepest thanks for your interest and support. May you and all those you love enjoy the most wonderful and bountiful Thanksgiving and transition into winter.

Cheers!

Jonathan Schechter
Executive Director

Income: The Mind Boggles

It’s hard to write a compelling narrative about a treasure-trove of data. Rather than subject either you or me to such a fraught exercise, below I offer a smorgasbord of figures I found compelling. Following this homage to Harper’s Index are some thoughts about the data’s implications.

Income

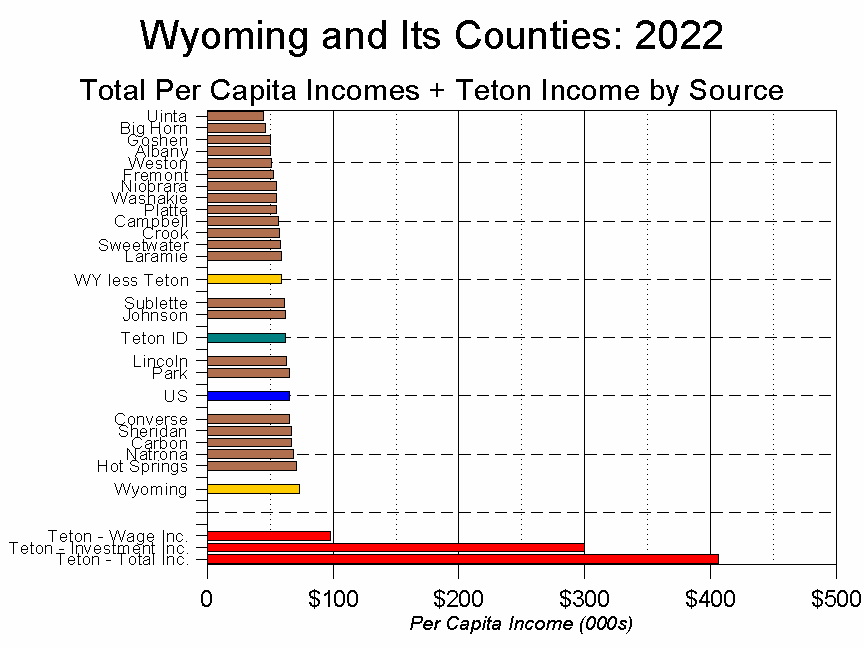
  • For 2022, the US Bureau of Economic Analysis estimated Teton County residents’ total personal income was $9.456 billion. With a population of 23,287, this meant that Teton County’s per capita income – the average income for every resident, regardless of age, work status, or any other consideration – was $406,054.
  • Teton County’s per capita income of $406,054 led the nation, and marked the 19th consecutive year in which Teton County had the nation’s highest per capita income.
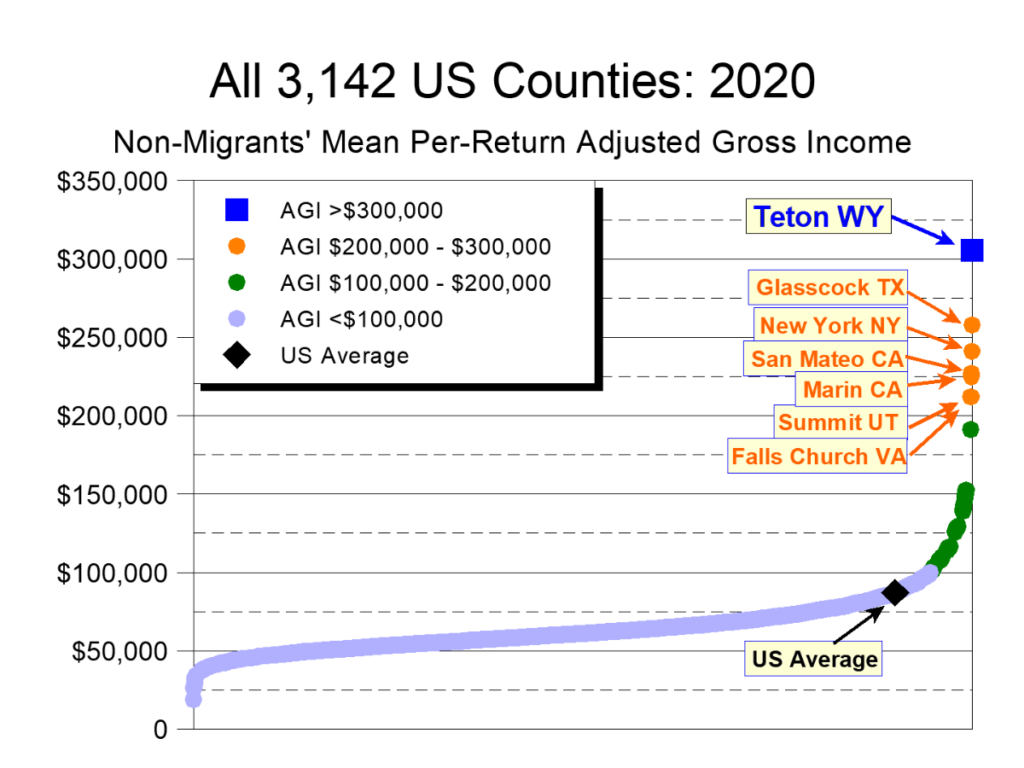
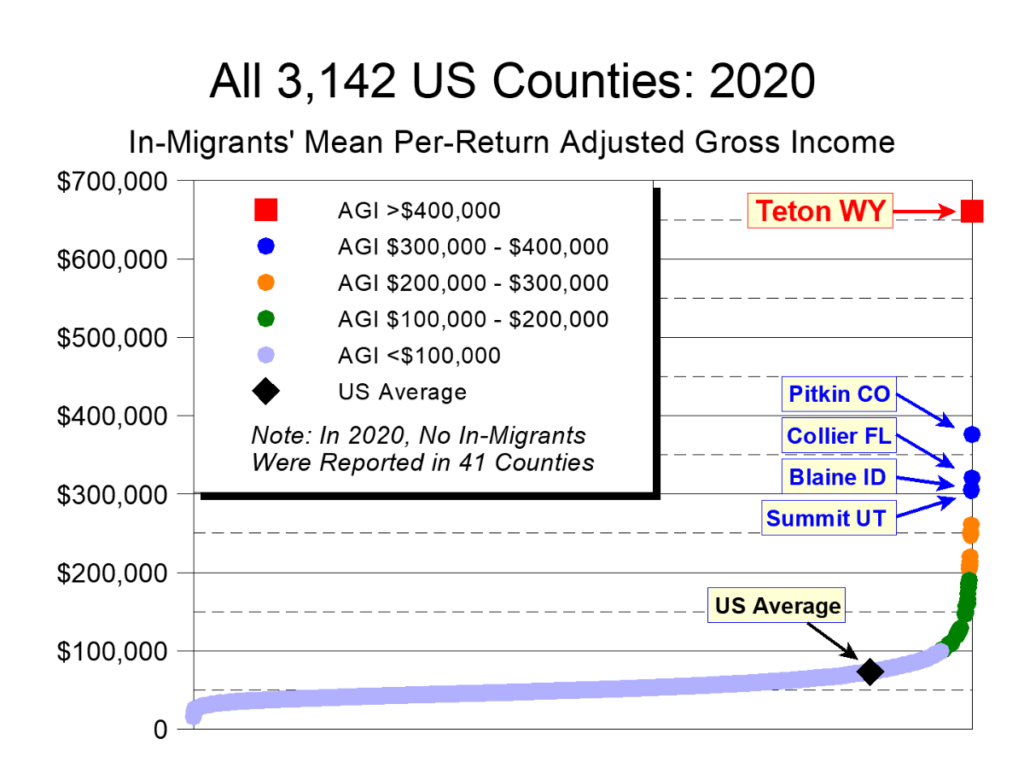
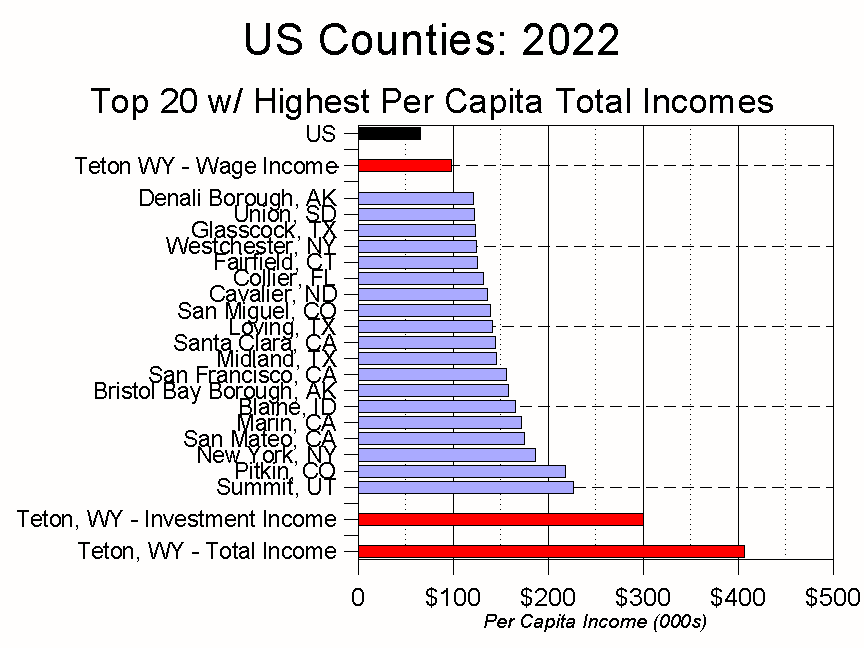
  • There are 3,114 counties in America. Teton County’s per capita income is ridiculously higher than any other county’s.
    • In 2022, Teton County’s per capita income of $406,054 was $340,584 higher – 6.2 times higher – than the nation’s overall per capita income of $65,470.
    • In 2022, Teton County’s per capita income of $406,054 was $180,058 higher – 80% higher – than that of second-place Summit County, Utah’s $225,996 (Summit County is the location of Park City).
      • The gap of $180,058 between nation-leading Teton WY and second-place Summit UT was essentially the same as the gap between second-place Summit UT and 2,189th place Perry County, Ohio (per capita income of $45,943).
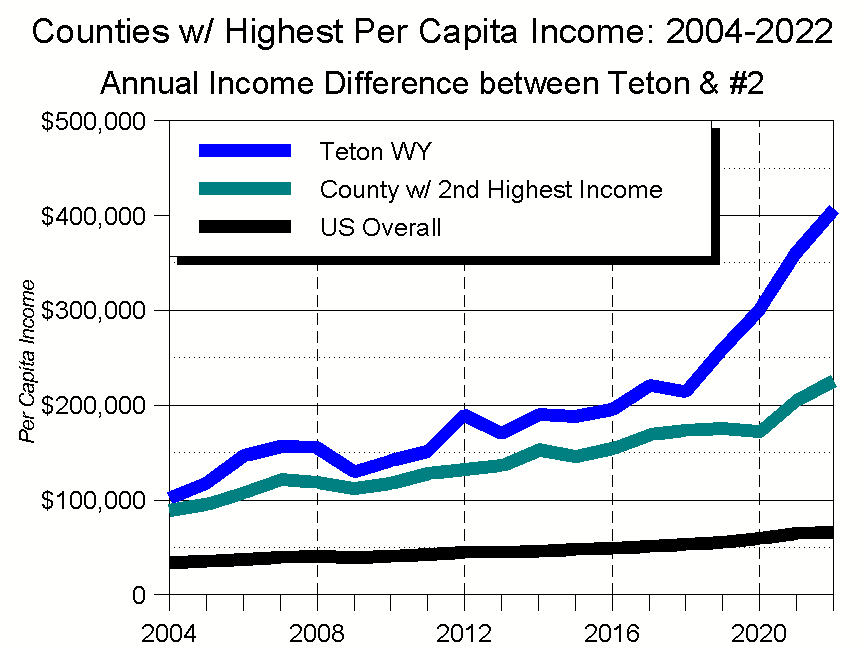
  • The gap between Teton County and the rest of the nation is growing.
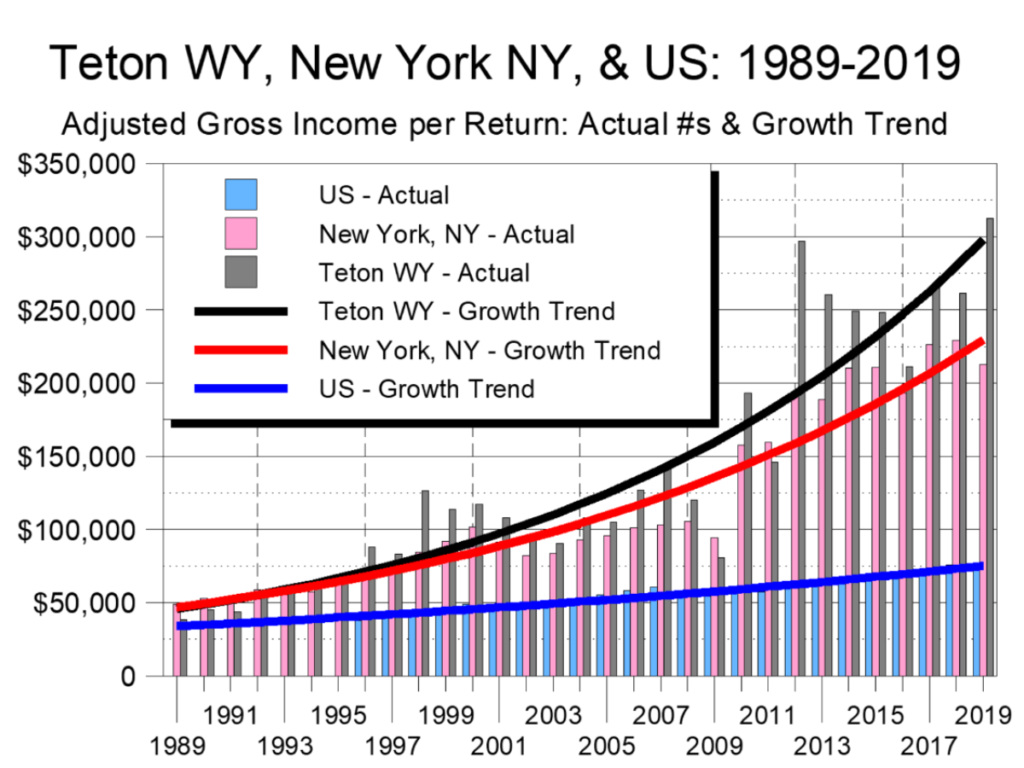
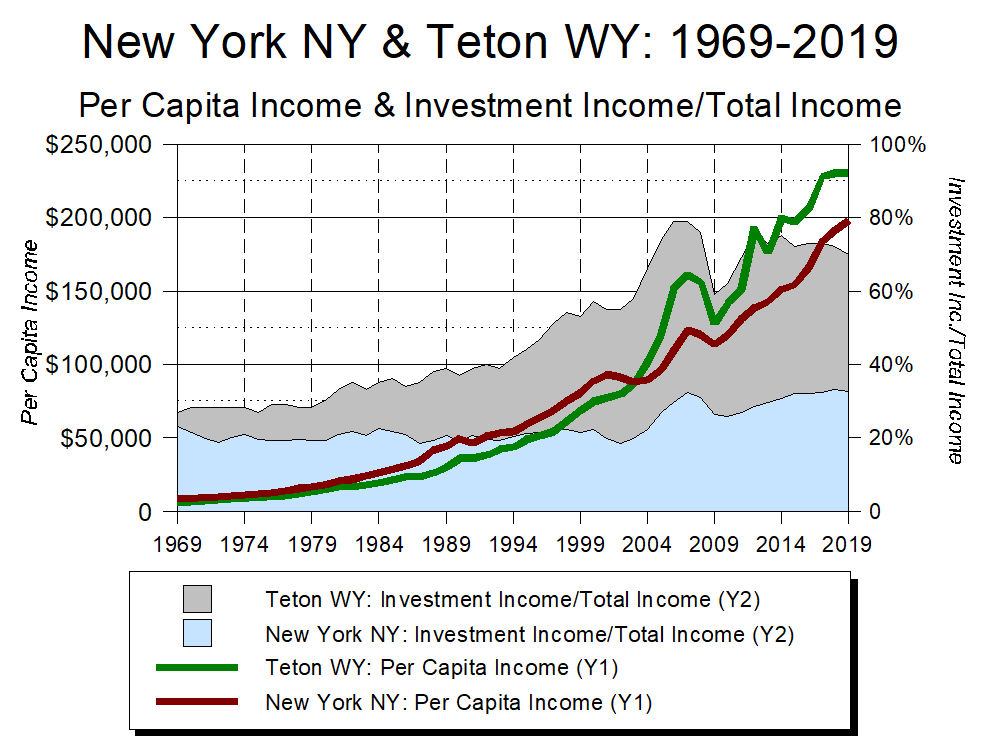
    • In 2004, when Teton County first led the nation in per capita income, the gap between Teton County and second place New York County (the island of Manhattan) was 20%. In 2022, the gap between Teton County and second place Summit County was 80%.
    • In 2004, Teton County’s per capita income figure was 3.0 times greater than the nation’s overall per capita income. In 2022, it was 6.2 times greater.
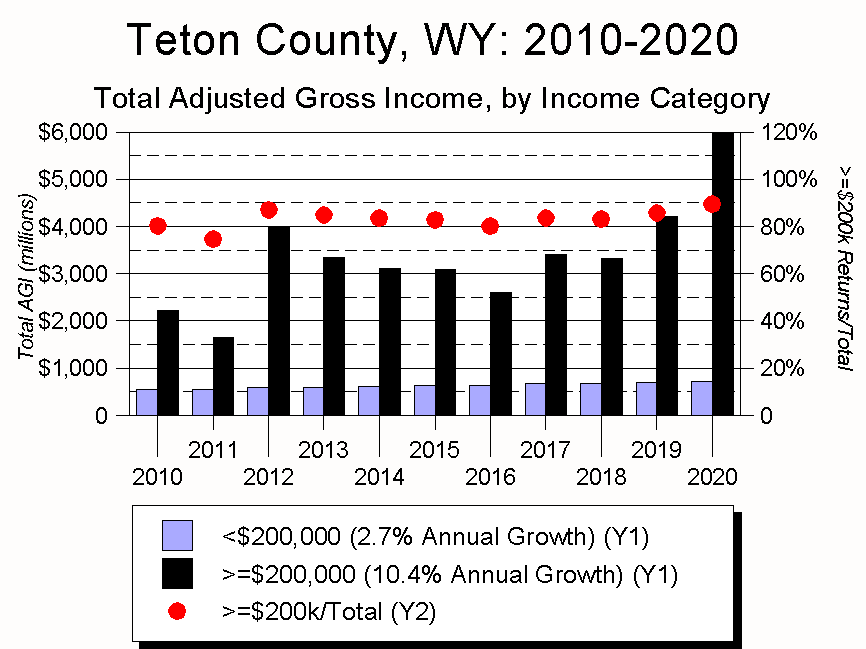
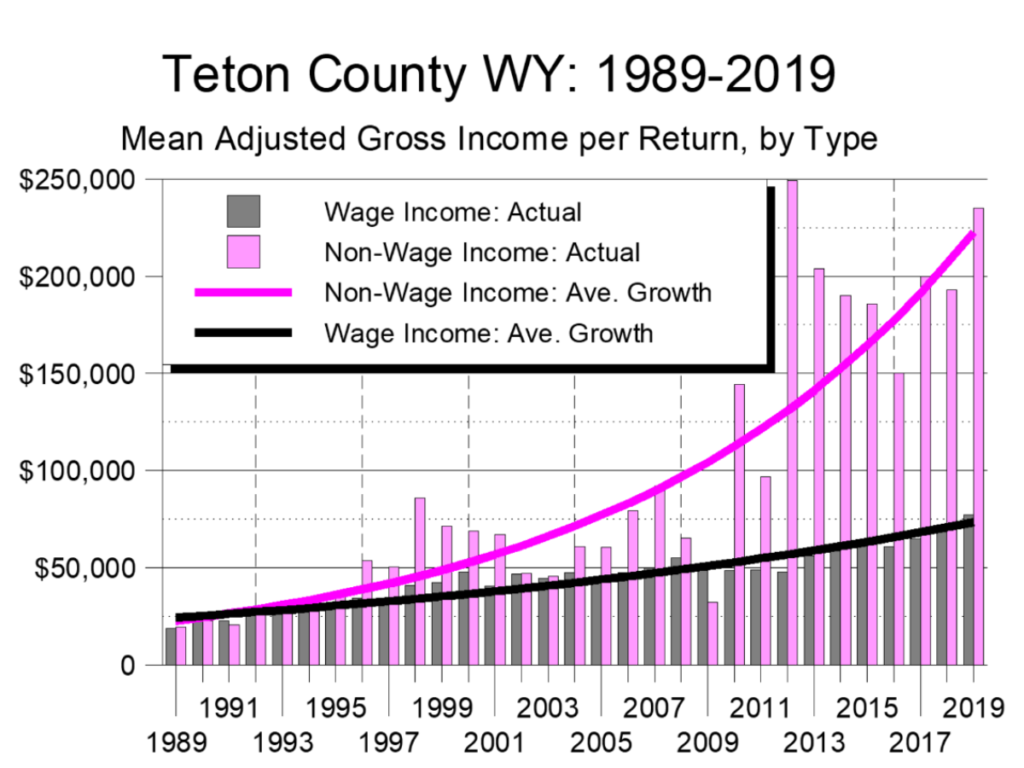
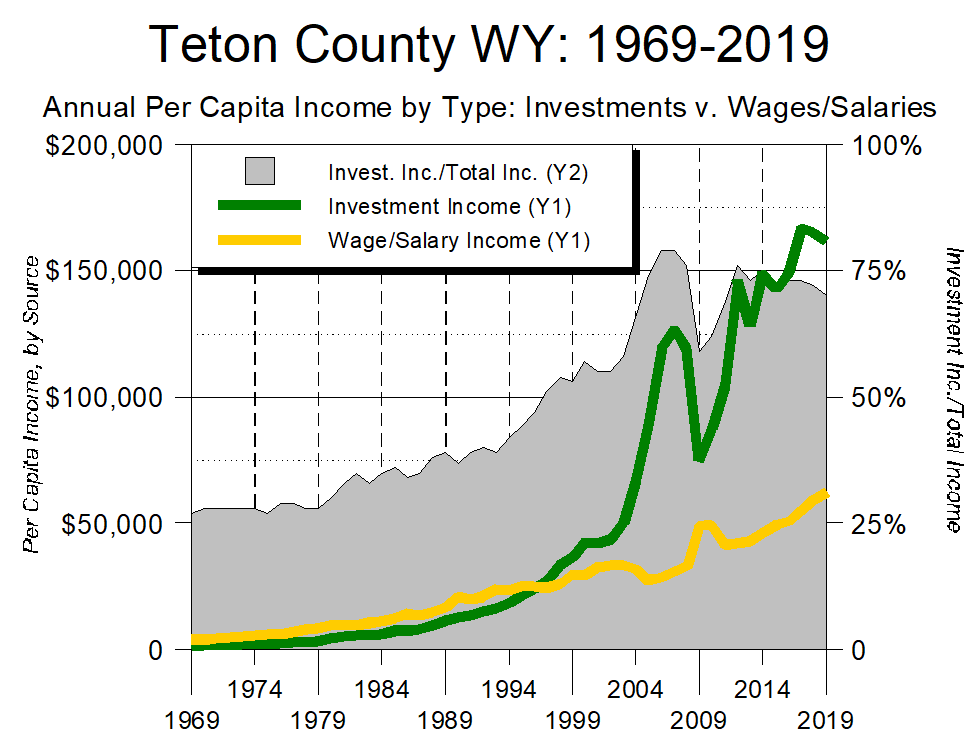
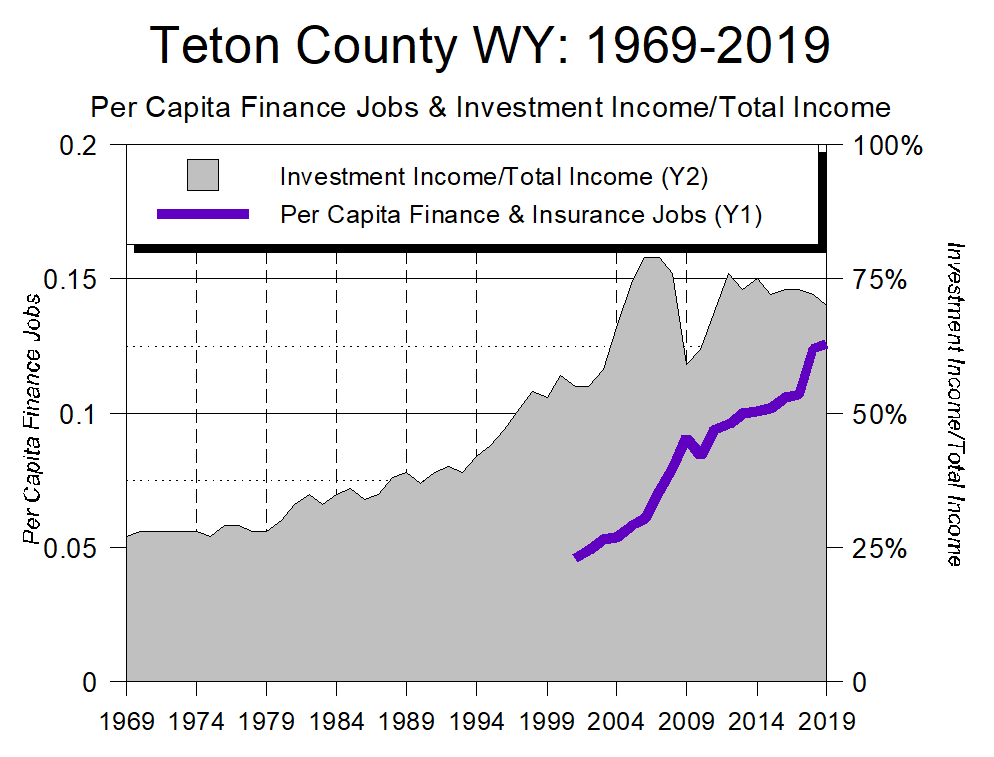
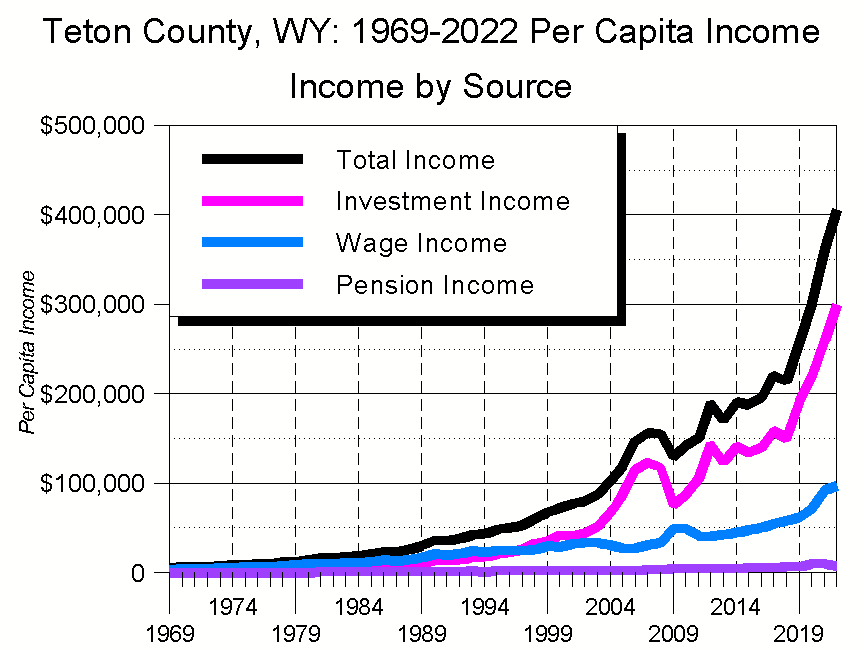
  • Investments account for the vast majority of Teton County’s income.
    • In 2022, 74% of Teton County’s income came from investments, 24% from wages, and 2% from pensions and government assistance programs.
    • In 2022, Teton WY’s per capita investment income of $299,811 was 32% higher than Summit UT’s total per capita income.
    • Even though it accounted for “only” 24% of Teton County’s total income, Teton County’s 2022 per capita wage income of $97,712 was, on its own, higher than the total per capita income of all but 64 US counties.
  • Teton County has 4% of Wyoming’s population and 22% of its total personal income. Teton County also accounts for 49% of Wyoming residents’ total investment income.
    • In 2022, Wyoming’s overall per capita income was $73,248, just 18% of Teton County’s figure
    • Had Teton County not been part of Wyoming in 2022, the state’s per capita total income would have been $58,361, 19% lower than its actual figure.
    • Had Teton County not been part of Wyoming in 2022, the state’s per capita investment income would have been $13,269. 46% lower than Wyoming’s actual figure of $22,450. (Figure 5)

Jobs: The Rise of Finance & Professional Services

  • In 2022, Teton County had 39,800 total jobs – 1.71 jobs per capita. This ranked Teton County 9th in the nation in per capita jobs.
    • In 2022, America’s overall per capita job figure was 0.64, roughly 1/3 of Teton County’s figure.
  • In 2022, only 39 of America’s 3,114 counties had more than one job per resident. Of these, just 14 had populations of 20,000 or more (smaller population sizes can skew calculations).
    • Among America’s counties with 20,000 or more residents, Teton County’s 1.71 jobs per capita ranked it second, trailing only New York County’s 1.94 (New York County is the island of Manhattan).
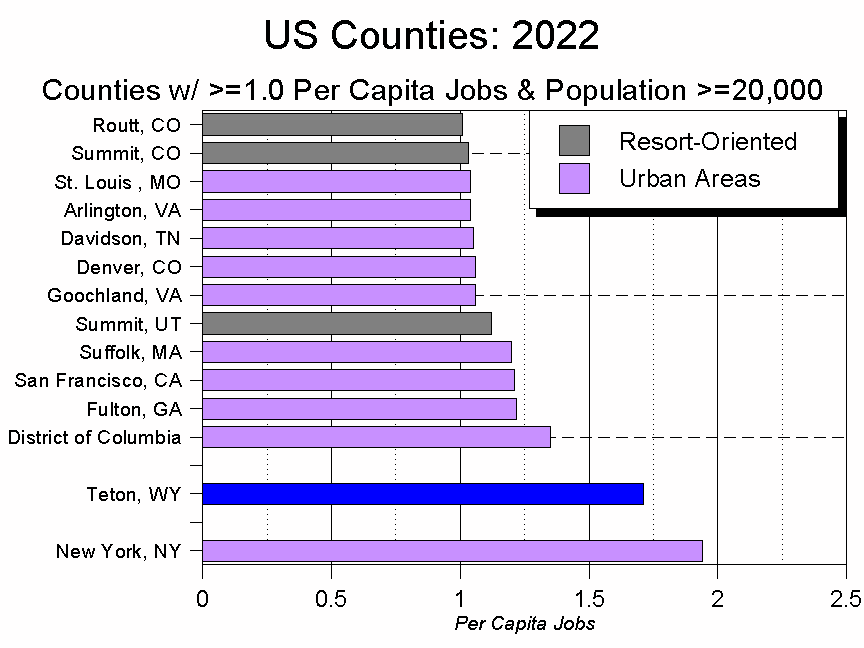
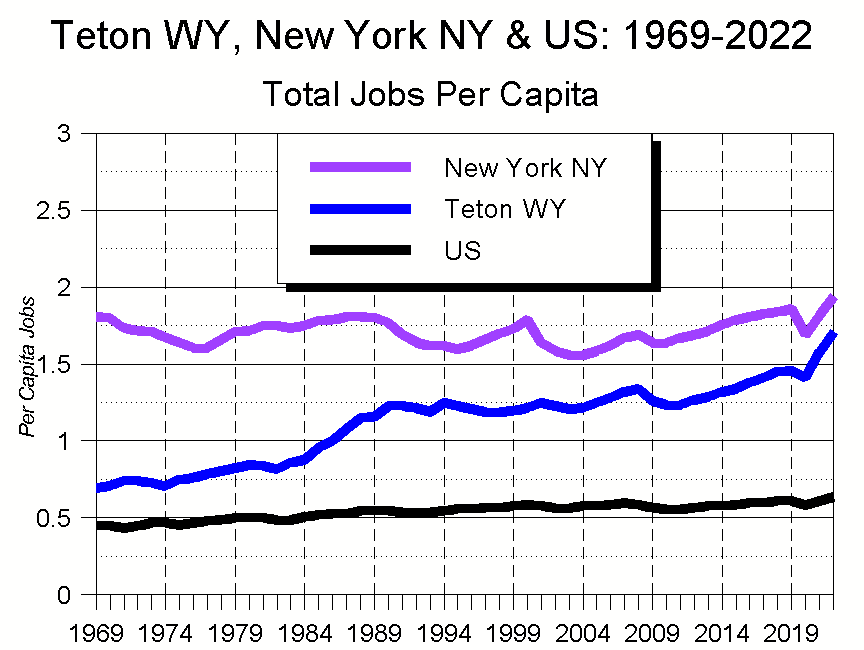
  • Over the past decade, among counties with 20,000 or more residents, Teton County’s per capita job figure has consistently been #2 to New York’s #1. During that time, the gap between New York and Teton County has been closing. In 2012, New York City had 33% more jobs per capita than did Teton County. In 2019, the last pre-pandemic year, the figure was 27%. In 2022, it was 13%. (Figure 7)
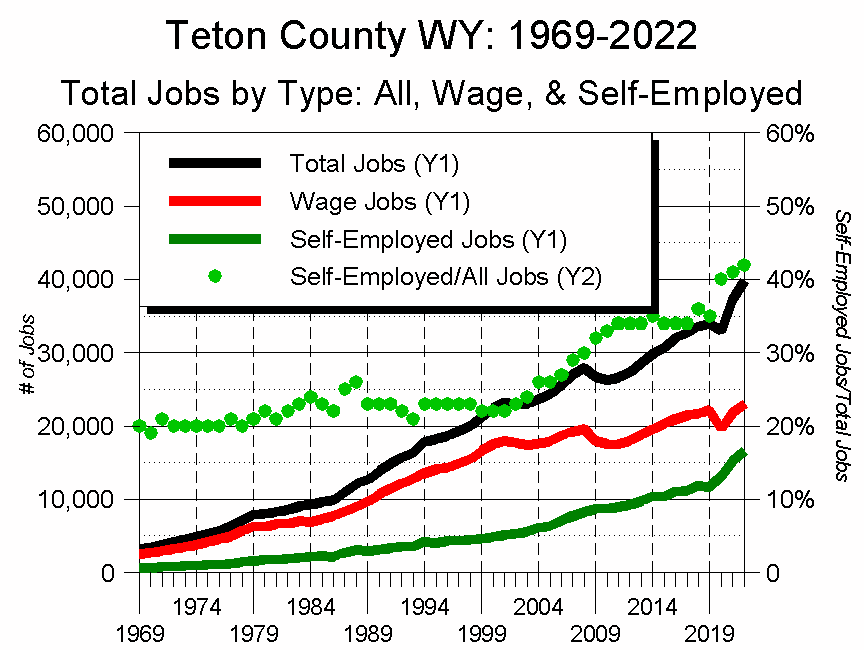
  • The BEA classifies all jobs as either wage-based or self-employed jobs (the latter category includes jobs ranging from real estate agents to remote workers). In 2022, 58% of Teton County’s 39,800 jobs were wage-based jobs. The other 42% were self-employed. In the US, the figures were 74% and 26% respectively.
    • Over time, as the number of remote workers has risen, Teton County’s mix between wage and self-employed jobs has shifted towards self-employment:
      • 2008 was the last year at least 70% of Teton County’s jobs were wage-based
      • 2019 was the last year at least 65% of Teton County’s jobs were wage-based
      • In 2022, 58% of Teton County’s jobs were wage-based. (Figure 8)
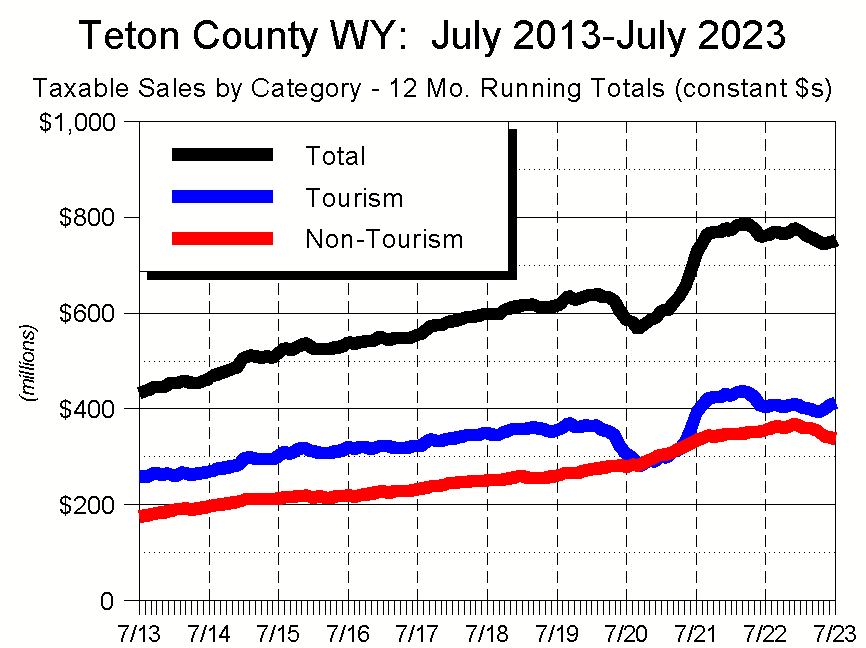
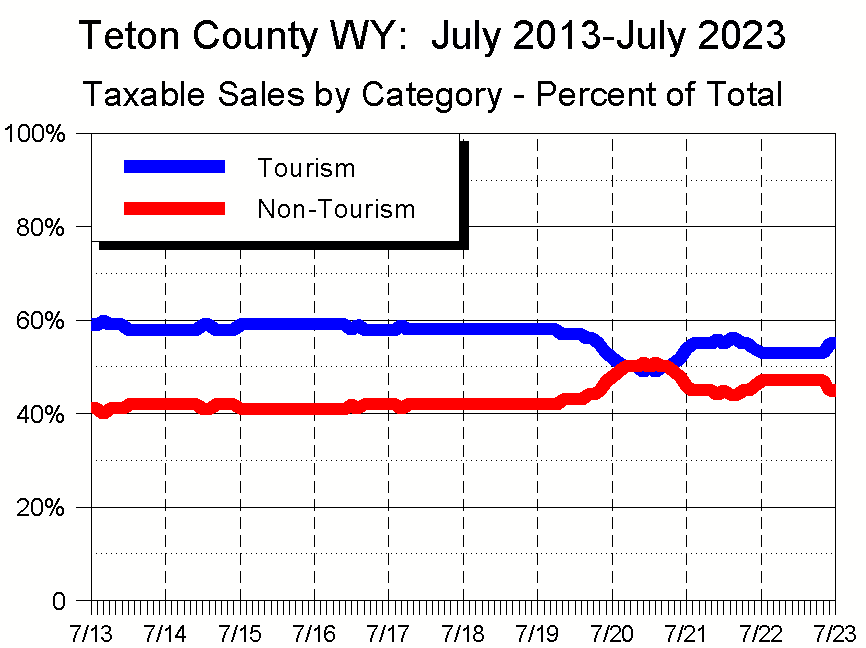
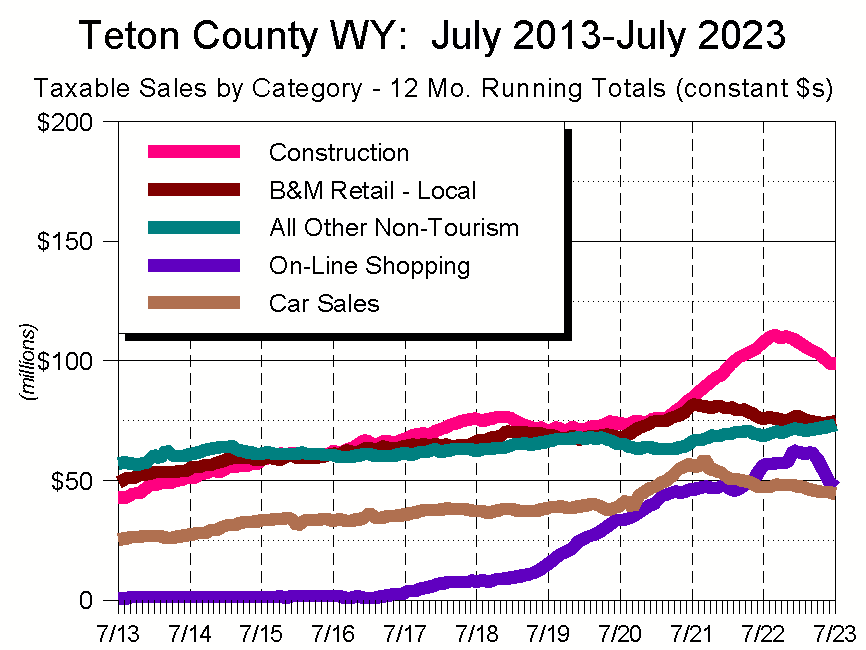
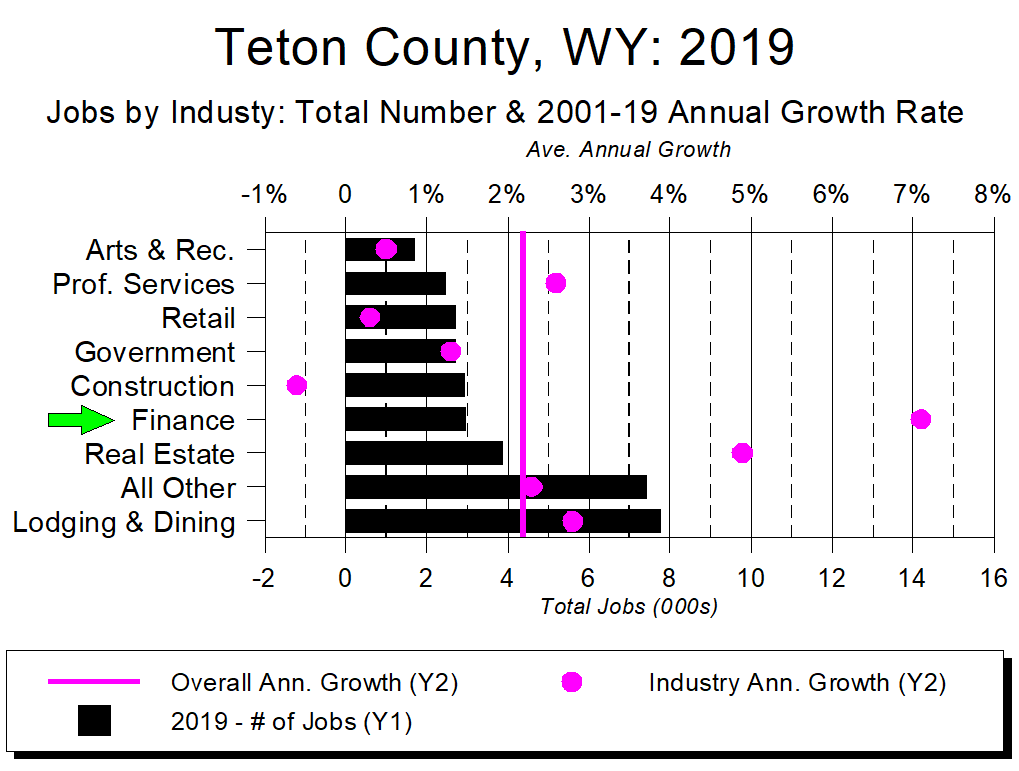
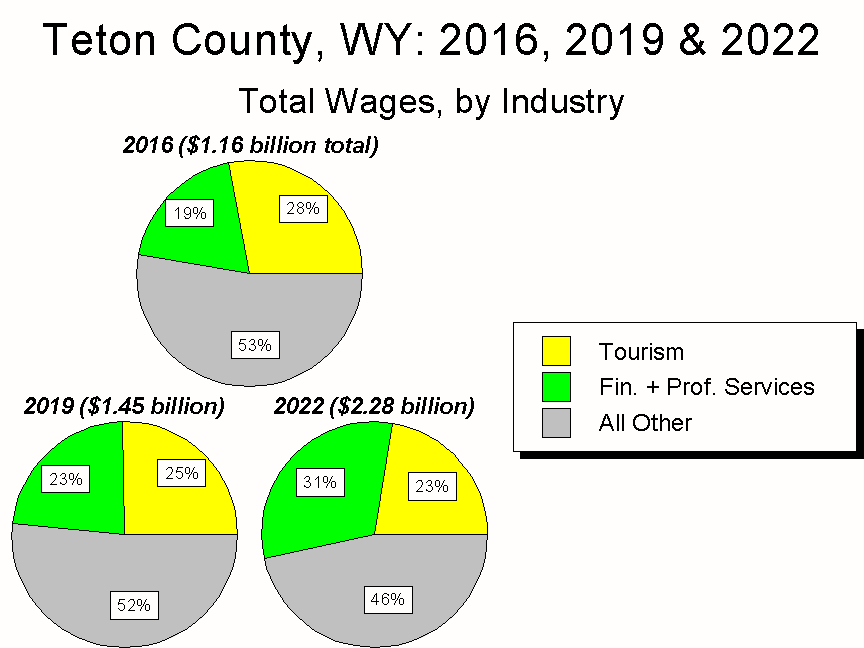
  • In 2022, Tourism-related jobs (Recreation and Lodging & Restaurants) accounted for 23% of Teton County’s total jobs and 19% of residents’ total wages.
  • Also in 2022, Location-Neutral jobs (Finance & Professional Services) were the other largest employment area, accounting for a virtually-identical 22% of the county’s total jobs. In contrast, these better-paying jobs accounted for 26% of residents’ total wages.
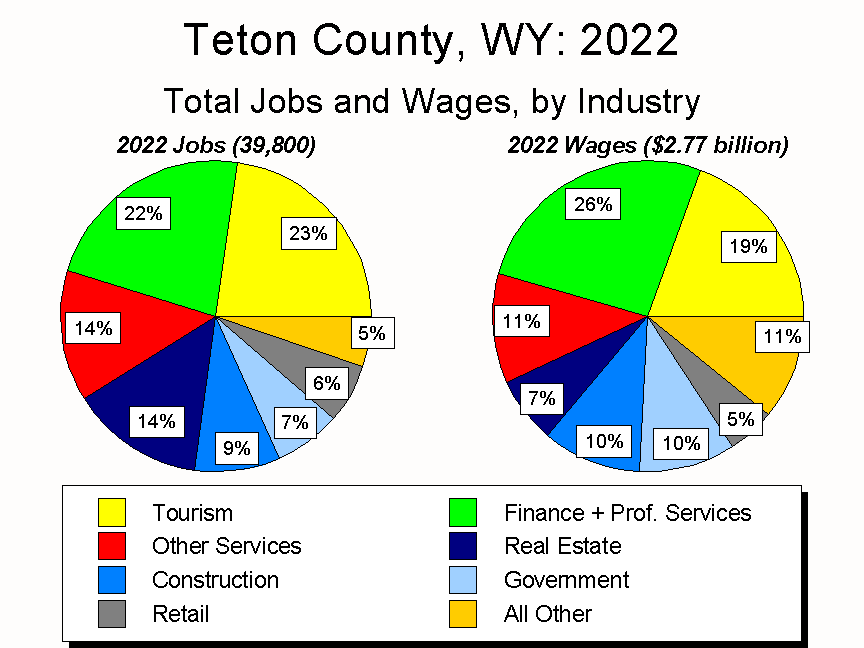
  • In 2022, Lodging & Restaurants were the biggest employer in the Tourism sector, accounting for 19% of all of Teton County’s jobs.
    • This proportion ranked Teton WY 23rd in the nation, ahead of such well-known tourism destinations as Clark County, Nevada (the location of Las Vegas) and Orange County, Florida (the location of Orlando). It also ranked Teton WY higher than every other major ski county in the US except Summit Colorado (Breckenridge).
  • In 2022, Finance was the biggest employer in the Finance/Professional Services sector, accounting for 14% of all of Teton County’s job.
    • This proportion ranked Teton WY 7th in the nation, ahead of such well-known financial centers as Fairfield County, Connecticut (the location of Greenwich) and Suffolk County, Massachusetts (the location of Boston).

Growth and Change

The COVID pandemic didn’t fundamentally change Jackson Hole or other desirable places to live. What it did do, however, was pour gasoline on an already-burning fire of growth and change.

COVID and Remote Working

Arguably COVID’s greatest long-term effect will be that it legitimized remote working. For huge numbers of people, the already stretched-and-frayed umbilical cord connecting work and home was suddenly completely severed, freeing them to live where they wanted to, rather than where work forced them to be. For better or worse, the “beneficiaries” of that liberation were places like Jackson Hole and other Greater Tetons area communities.

The folks best able to take advantage of this fundamental shift are those with Location-Neutral incomes. The most Location-Neutral income of all is, of course, investment income, which continues to pay regardless of where someone lives. For those reliant on wage and salary incomes, jobs in Professional Services and Finance are often Location-Neutral.

From that perspective, Teton County, Wyoming leads the nation in its percentage of Location-Neutral income, as well as its per capita Location-Neutral income amount.

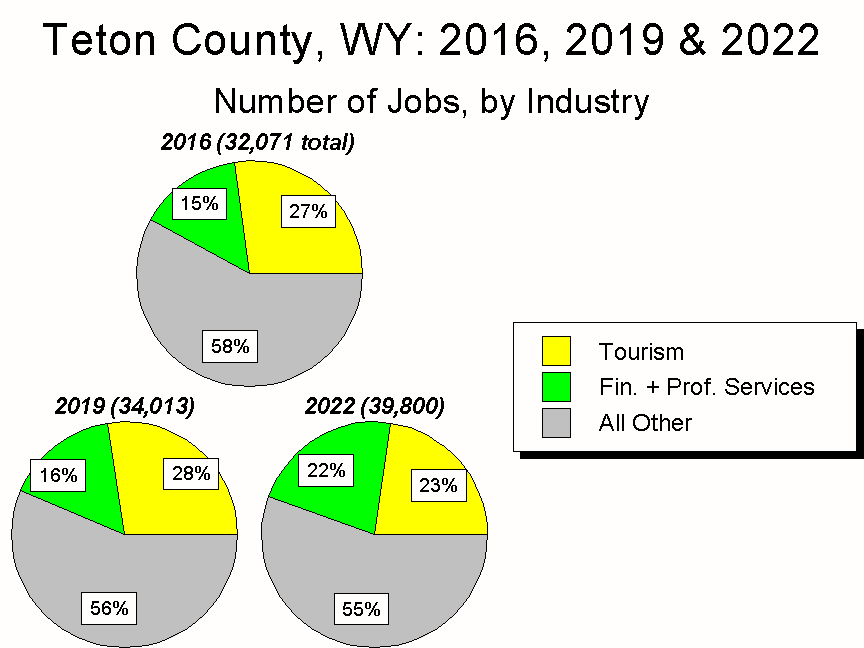
At the other end of the jobs spectrum – i.e., jobs which are Location-Dependent – are those in Tourism, for no one has yet figured out how to remotely load lifts, clean hotel rooms, or serve and cook restaurant meals. This makes it illuminating to compare Jackson Hole’s Location-Neutral and Location-Dependent economic indicators before and after the pandemic hit in 2020.

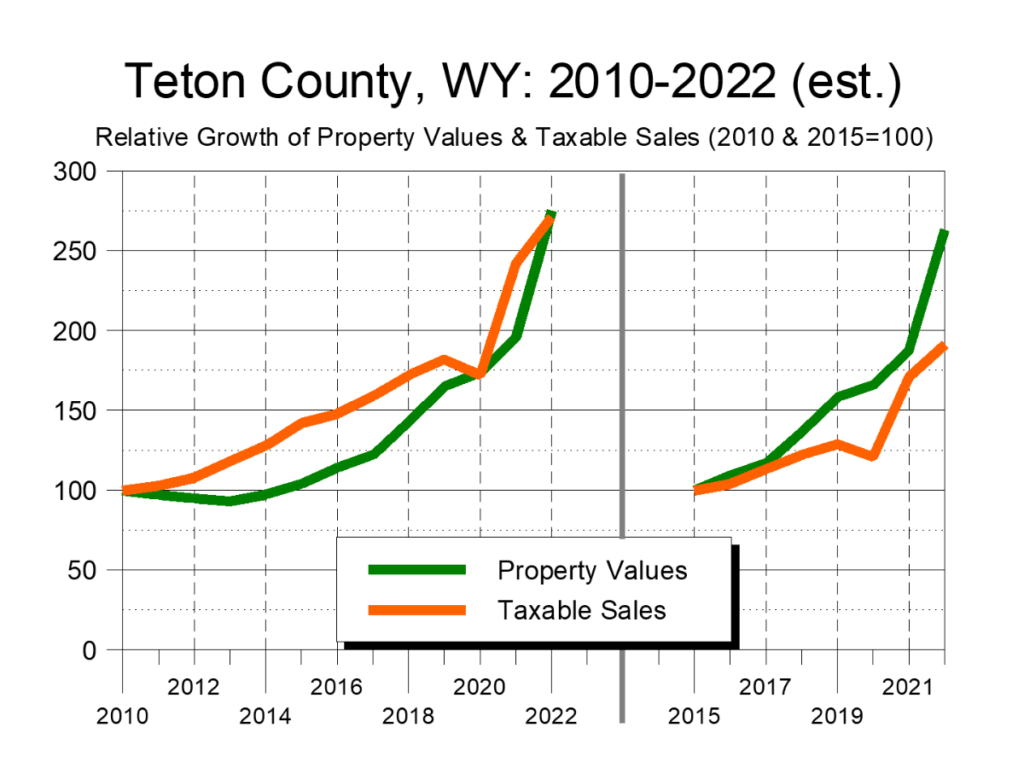
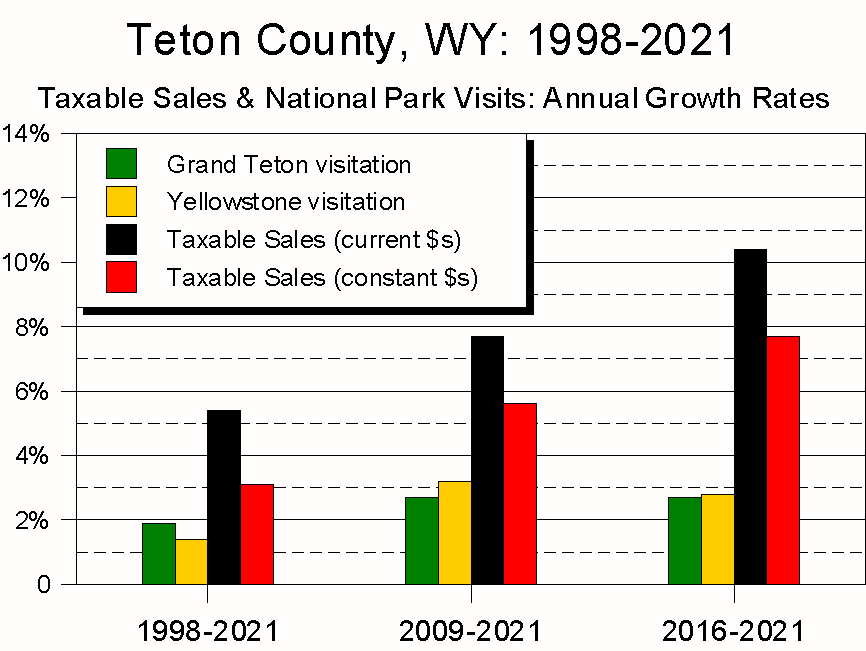
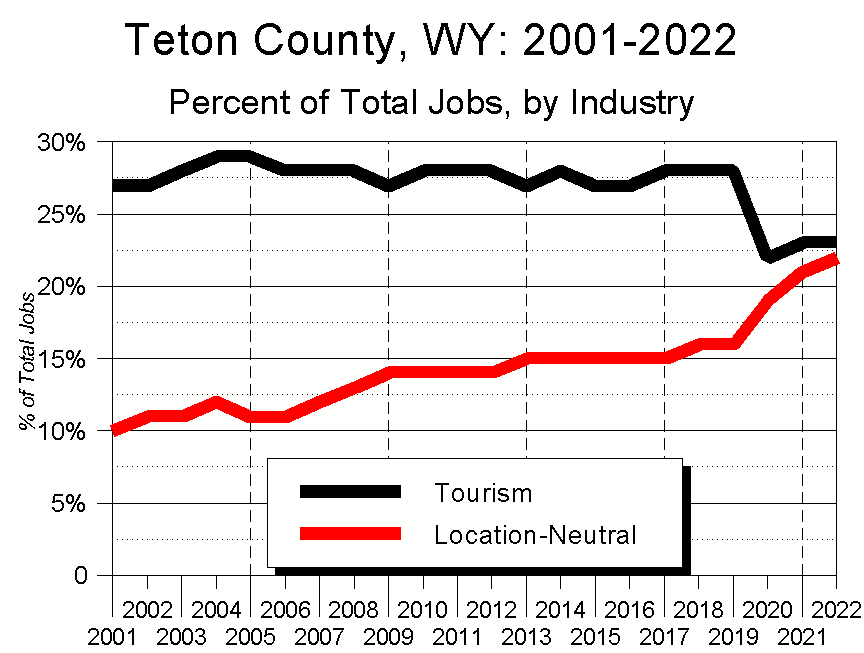
The table below summarizes how big a pivot the pandemic proved for Teton County. In the three years before the pandemic, Teton County enjoyed good economic growth; in the three years from 2020-2022, it experienced extraordinary growth.

The COVID Pivot

Between 2020-2022, Teton County also experienced an extraordinary – and extraordinarily rapid – shift in the composition of its economy.

Not in its population – Teton County’s population has remained essentially flat since 2016. What has changed, however, is the composition of that population.

Specifically, in the three years between 2016-2019, Teton County’s overall income grew 33%; in the three years between 2019-2022, it grew 56%.

More strikingly, in the three years between 2019-2022, while the mix of residents’ total income didn’t change much – 73% came from investments in 2019, while the figure was 74% in 2022 – what changed dramatically was the composition of its jobs.

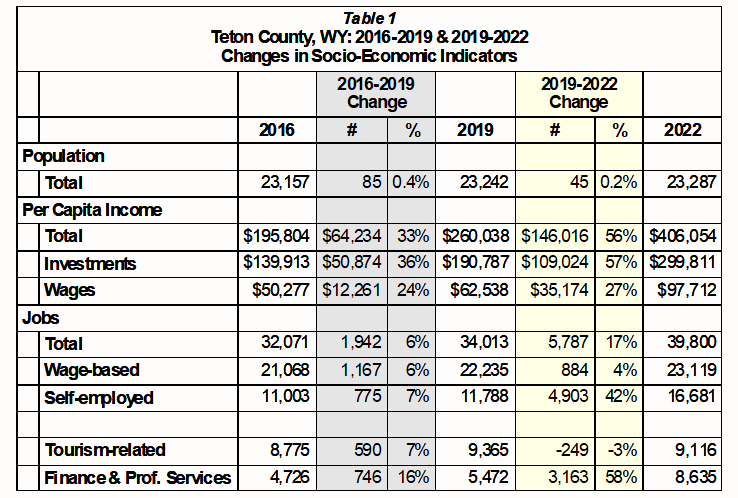
  • In 2019, 28% of Teton County’s jobs were in Tourism (Recreation, Lodging, and Restaurants). In 2022, only 23% were.
  • In 2019, 16% of Teton County’s jobs were Location-Neutral (Finance or Professional Services). In 2022, 22% were.

This was after essentially no change in the job mix between 2016-2019.

Wages Followed Jobs

  • In 2019, 25% of Teton County’s wages were in earned in Tourism. In 2022, only 23% were.
  • In 2019, 23% of Teton County’s wages were earned in Finance or Professional Services. In 2022, 31% were.

The Biggest Shift in History

What does it all mean? Just this.

Big picture, between 2019-2022, Jackson Hole’s economy changed more than at any other time since 2001, and arguably in its history. As a result, from a socio-economic perspective, today’s Jackson Hole is in an awkward adolescent phase, evolving from taking care of visitors to providing financial and professional services to a worldwide clientele.

Put another way, to see the future of Jackson Hole’s workforce and culture, look more to New York City or San Francisco than other national park gateway communities or tourist Meccas such as Orlando.

Part of this has to do with Wyoming’s wealth-friendly tax and trust laws. But as noted above, while Teton County is home to just 4% of Wyoming’s population, it accounts for 22% of the state’s total personal income and 49% of its investment income. If the well-to-do aren’t living in other parts of Wyoming, other factors must be at work.

What might those other factors be? One is clearly the region’s ecosystem. Respondents to my recently-completed public opinion survey ranked the area’s ecosystem as the thing they most valued about the region – more so than the community and far more so than the economy. But here again, the ecosystem has always been an attractor, so what’s changed?

Geographic Isolation Matters Less

As I’m coming to see things, the biggest drivers of change in Jackson Hole are the technologic and market forces combining to obliterate the importance of Jackson Hole’s geographic isolation.

Throughout history, the Tetons region’s rugged, remote qualities have served to shape not just its culture but its economy. No more. The same global forces that are upending the Earth’s climate, economy, and institutions may not be affecting Jackson Hole’s geologic features, but they are rapidly and profoundly changing pretty much everything else about the region: ecologically, economically, and from a community perspective.

For example, global warming is clearly affecting Jackson Hole’s flora and fauna, terrestrially and aquatically. Similarly, outside forces are affecting the valley’s cultural make-up, as COVID migrants and other newcomers replace others who choose to leave (or perhaps are getting priced out…).

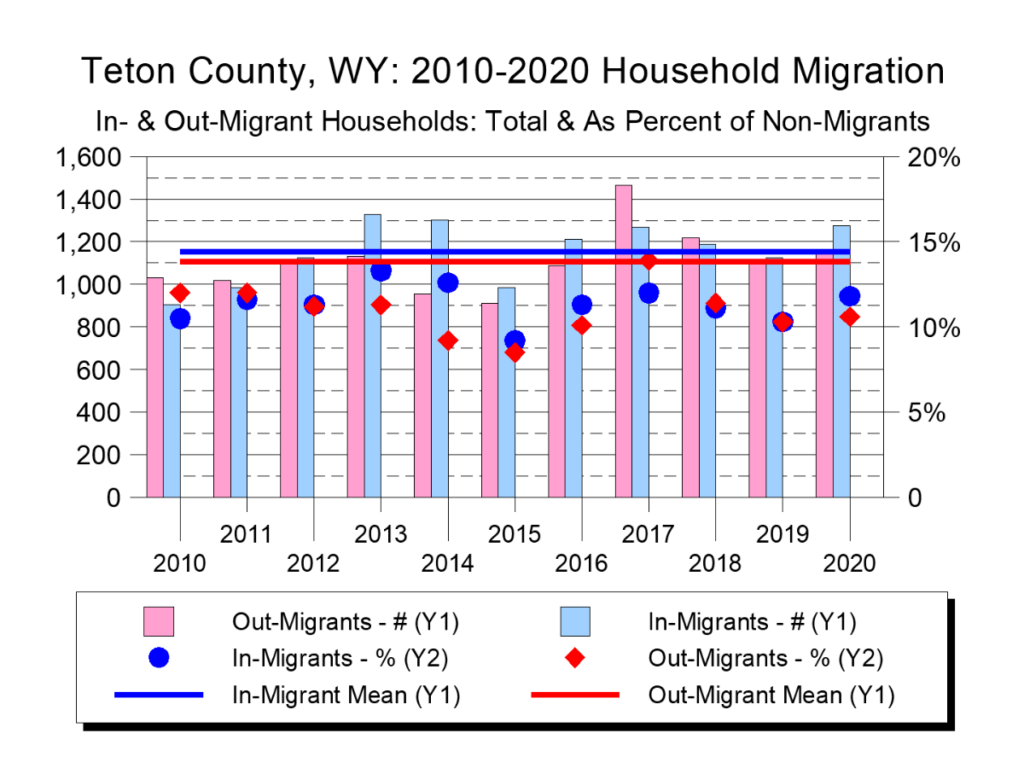
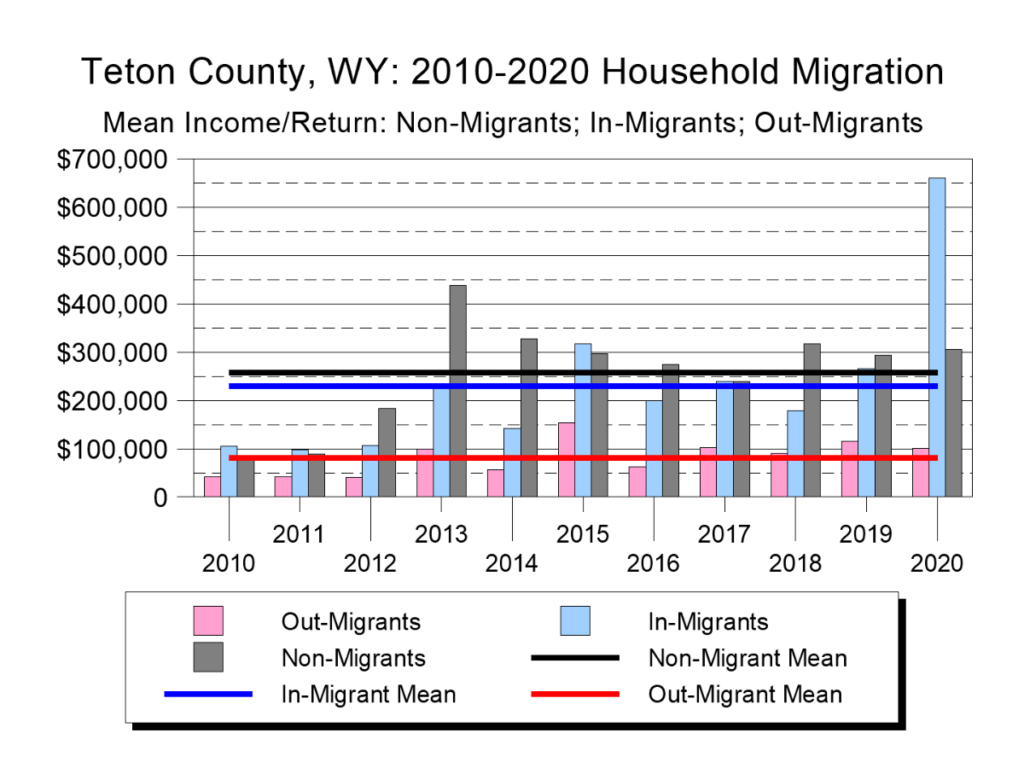
Turnover is nothing new in Jackson Hole, of course – historically, there’s a 10%-15% turnover as one year’s residents are replaced by a similar number of newcomers. What makes the past few years different is the amount of wealth recent newcomers have brought to the community.

Who Are We?

And then there is a really interesting question, one almost existential in capturing just how profound our upheaval is proving to be: Who are we?

More precisely, here’s the question suggested by the BEA data: Are we a Tourism community, or are we a Location-Neutral community? In a Zen Koan-esque fashion, for Jackson Hole the answer is “yes.” In fact, it’s more “yes” than for any other county in America.

The graph below looks at every county in America. The X axis measures the percentage of a county’s Location-Neutral jobs; the Y axis measures the same thing for Tourism jobs (Figure 10)

In 2022, Teton County had an essentially identical percentage of both Tourism jobs (23%) and Location-Neutral jobs (22%). Just three years earlier, the percentages were 28% and 16% respectively.

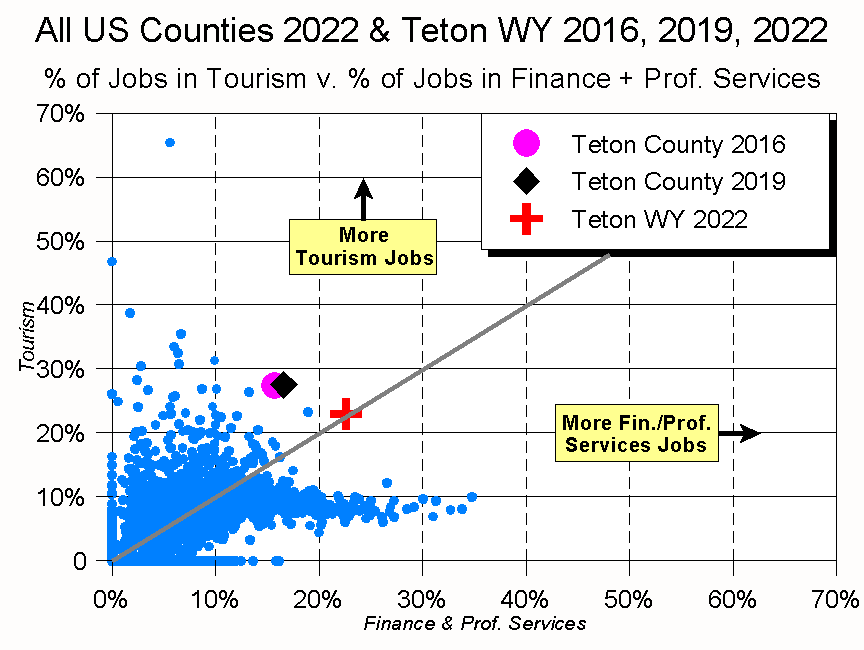
A Balance Like No Other

That is a wild and rapid swing in the community’s jobs base. Even more striking, though, is that in 2022, Teton County reached a point of equipoise, balanced like no other American county in its large percentage of Location-Neutral jobs and its large percentage of Tourism jobs. As a result, we were in the top 1% of all counties in both categories, a claim no other county could make.

Which is crazy. Why? Because Tourism and Location-Neutral industries have fundamentally different business models.

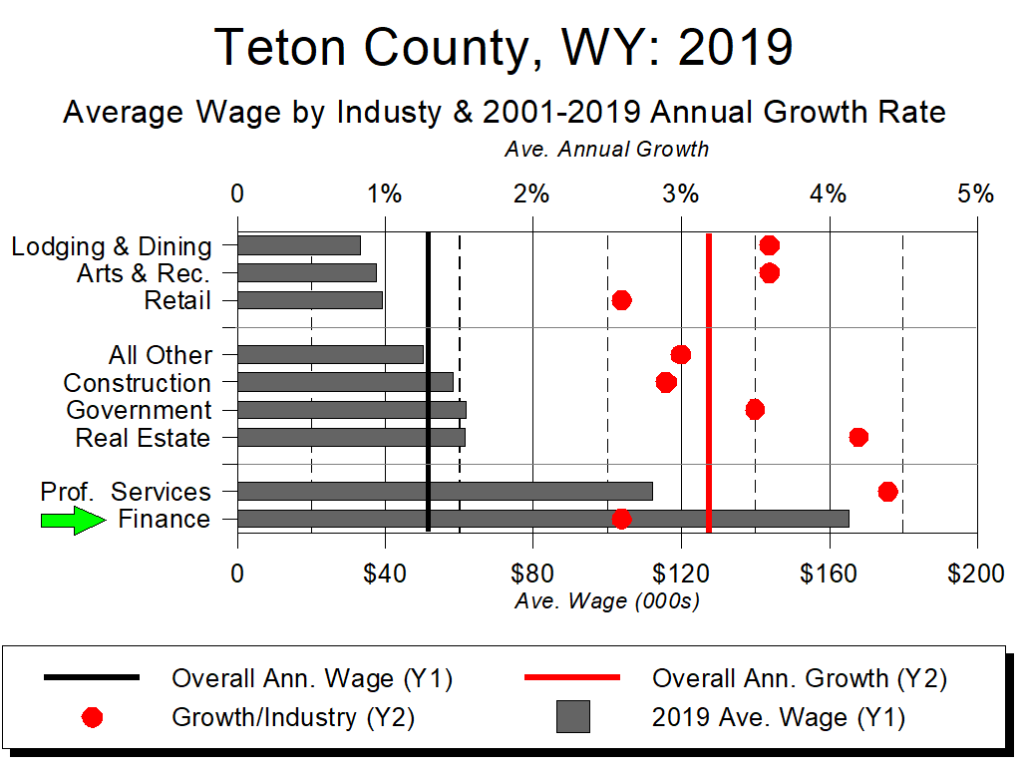
Different Business Models

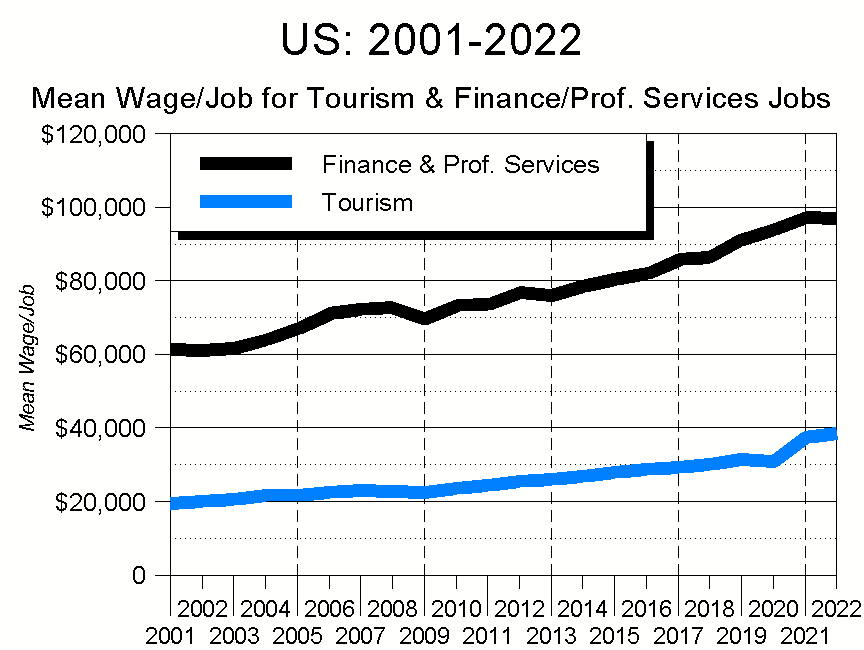
As a rule of thumb, Tourism businesses hire a lot of people and pay them relatively low wages. Location-Neutral businesses can also be big employers (think about how many people you see in a bank lobby), but their business model allows them to pay a lot more.

The result is a huge pay gap between the two industries. And even if the pay gap continues to narrow as it has in the last few years, over time Tourism will find it increasingly difficult to compete for employees, making things increasingly difficult for an industry which has long-defined Jackson Hole.

So who are we?

Ultimately, the only way lower-wage industries like Tourism can succeed is to have access to low-cost housing, which in turn requires low-cost land. Arguably, that once was possible in Jackson Hole, for our geographic isolation allowed for housing prices to be more closely tied to the local economy. No longer though – the technology-driven demand to live in our increasingly-connected region has fundamentally shifted the region’s supply/demand balance. And as demand increases, it’s not just Tourism being affected, but any location-dependent industry (e.g., health care, education, and government).

In short, barring fundamental changes to the nation’s economy, any person or industry without a direct link to investment income and other sources of wealth is going to find it increasingly hard to live in Jackson Hole and, ultimately, the greater Tetons region. What we should do about that – if anything – is the fundamental policy question facing not just local government, but the community as a whole.

Conclusion

There is no particular significance to Teton County exceeding $400,000 in per capita income. Any more than there was in us hitting the $300,00 mark two years earlier. Or $200,000 three years before that.

Each level has huge symbolic meaning, though, for each represents – in increasingly stark terms – the forces of growth and change washing over Jackson Hole. Each also represents the kind of community those forces are creating.

America relies on market forces to allocate resources. And while government policy tweaks things a bit here or there, our underlying belief is that the combination of market forces and economic self-maximization produces the best possible outcome for society as a whole.

No state embraces this philosophy as actively as Wyoming, where we consciously limit government powers and have created the nation’s most wealth-friendly tax and trust laws. All this has reached its apotheosis in Teton County where, as noted above, we have 4% of the state’s population and 49% of its investment income.

Does Wealth = Happiness?

So why is there a sense of despair?

My recent survey of the region’s residents not only showed we prioritize the environment over community, and community over the economy, but that we were pessimistic about where things are heading. We’re also not happy about how things are today versus how they were before.

Again, why? We have become rich beyond the dreams of avarice, yet something seems amiss.

Perhaps a clue lies in the obituary of my late friend, the beloved author and Kelly School teacher Ken Thomasma. Mr. Ken loved telling the story of how, in the 1980s, he camped out for several days on the roof of Fred’s Market. He did so to help raise around $150,000 in community donations for supplies the school district simply couldn’t afford.

When Ken climbed onto Fred’s roof, Teton County’s per capita income was around $17,000. As a result, during his “camp-a-thon” Ken was trying raise 10 times what the “average” Jackson Hole resident earned. In today’s dollars, his $150,000 target would be around $450,000. Which is, of course, just a little more than what one “average” Jackson Hole resident earns today.

The idea of someone doing today what Ken did 40 years ago is almost inconceivable. In part that’s because we have so much more money, which of course is a great thing. In part, though, it’s because the equation for how we give back to the community seems to have switched from giving time to giving money.

For me, this reality calls to mind a quote which seems as relevant today as when it was first uttered in 1909, in a speech at UC Berkeley by Lord James Bryce, a British diplomat and historian:

“What will happen when California is filled by fifty millions of people, and its valuation is five times what it is now, and the wealth will be so great that you will find it difficult to know what to do with it? The day will, after all, have only twenty-four hours. Each man will have only one mouth, one pair of ears, and one pair of eyes. There will be more people – as many perhaps as the country can support – and the real question will not be about making more wealth or having more people, but whether the people will then be happier.”

Two Points

From Lord Bryce’s vantage point, the survey results and BEA data seem to make two points.

First, the BEA data affirm what we know in our guts: Jackson Hole is changing, both rapidly and profoundly. The forces washing over the Tetons are the same ones that, across the planet, are producing massive upheaval in not just the world’s economies, but also how we interact and coexist with each other.

Second, despite being the wealthiest county in the wealthiest country in the history of the world, we’re still beset by a number of challenges. Some are inherent to the human condition; others the result of how we allocate our resources and what we choose to prioritize. Collectively, those challenges seem to be creating a community that many folks feel isn’t working well; a once-special place slipping away at an increasingly rapid rate.

Three Questions

Given this, I think we’ve reached a point where we need to ask ourselves three simple questions. Simple to ask; hard to answer.

The first is the one noted above: “Who are we?” What do we care about? What do we want for ourselves?

Historically, we’ve taken who we are for granted. We haven’t had to ask because we haven’t had to think about it. Combined, economic forces and our geographic isolation not only answered the question for us, but gave us an answer we very much liked. As we have become both more connected and more similar to the outside world, however, it’s fair to wonder whether this approach will continue to work.

Second: “Do we like where we’re going? ” The BEA data paint a picture of a rapidly-changing community, one hallmarked not just by increasing wealth, but an increasing concentration of wealth. Perhaps even more important, our economy is becoming increasingly disconnected from the natural world around us.

Throw in a set of governmental tools perfectly suited for the mid-20th century but increasingly feeble today, and it’s pretty clear where, barring significant change, the community and region will be in 10, 20, 50 years. Is that what we want?

Finally, if we don’t like where we’re going, we need to ask ourselves a third, equally important question: “Do we care enough to make meaningful changes?” For absent that passion, any effort will likely be for naught.

Why? Because the forces at play are extremely powerful, and there’s no clear blueprint for addressing them. Part of the answer lies in aligning incentives, in somehow developing a jujitsu-like approach to guide those forces towards where we want to go. But because we’ve never done anything like that, the process will likely be a hard slog.

Many hard slogs end up with a great result. Because there are no guarantees, though, to have a chance of success will require vision, grit, and a profound sense that the community’s future is worth it.

Which, of course, it is. The opportunity is at hand – together, let’s seize it.

Filed Under: Uncategorized

A Surprisingly Strong Summer & Thanks for Your Help

September 18, 2023 By //  by cothrivejs

Hello, and happy near-Equinox!

When I write these newsletters, my goal is always to come up with some big “AHA!” moment for both myself and my readers. Something that will cause all of us to see ourselves – whether the Tetons region or, with luck, the broader world – through a new lens. To gain an appreciation for not just some new fact, but a new way of viewing what’s going on around us.

That’s my rationale for publishing sporadically – I want to emphasize quality over quantity.

I’m not sure if I hit my AHA goal with this missive, but I sure gave it a try.

The motivations underlying this particular edition are three-fold. One is esoteric; the other two completely pragmatic.

Starting with the latter, pragmatic reason #1 is that the donation window for Old Bill’s Fun Run closes today – Friday, September 15 – at 5:00 pm MDT. Please click HERE to support this newsletter and the other work Charture does to help make ours a better community.

Pragmatic reason #2: Speaking of work Charture does to make ours a better community, please click HERE to take the public opinion survey we’re running. It’s purpose is to gauge residents’ feelings about our region’s present and future. The survey will remain open for another week – until 11:59 pm on Friday, September 22 – and I hope to get as many responses as possible.

Esoteric reason: For months now, the region’s tourism industry has been super-anxious about having a “soft” summer. In the last few days, visitation and sales tax data have been released suggesting it’s been just the opposite.

I created the public opinion survey because I’ve been wondering a lot about whether there’s a disconnect between residents’ perceptions and the realities of where the community is and where we’re heading. The recently-released data only amplified that curiosity, because the “soft summer” fear v. the “good summer” reality seems to reflect an on-going gap between how we view the world and what is actually going on.

Add the three together, and you get today’s newsletter. My hope is that it provides you with a tangible example of why we’re worthy of your support in both filling out the survey and supporting us through Old Bill’s Fun Run.

As always, deepest thanks for your interest and support.

Cheers!

Jonathan Schechter
Executive Director

PS – Please be sure to take our public opinion survey by clicking HERE or scanning the QR code below. Please also encourage everyone you know to do the same.

PPS – Please donate to Charture through Old Bill’s Fun Run by clicking HERE.

Scan this code to link to our survey. Let us know how you feel about the Greater Tetons Area and its future

The Changing Nature of Our Extraordinary Growth Machine

Over the past 25 years, Teton County’s total taxable sales grew 250% – from $659.3 million in the fiscal year ending in July, 1998 to $2.30 billion in the FY ending in July, 2023. Annualized, this is a compounded annual growth rate of 5.1%

During that time, Teton County’s taxable sales have been hallmarked by four periods of steady growth, and three shorter stretches of sharp decline. Over the past year, things have markedly slowed down: between July 2021-July 2022, total taxable sales grew 13.6%; since then, they’ve grown just 2%. In fact, taxable sales have actually declined since their peak in the FY ending December 2022.

Inflation

Because of inflation, though, these numbers tell an incomplete story. Over the last 25 years, as measured by the Consumer Price Index, the US rate of inflation has ranged from 9% to -2%. Correcting for inflation, Teton County’s total taxable sales have grown from a constant dollar figure of $404.0 million in the FY ending in July 1998 to $753.8 million in the FY ending in July 2023, an increase of 87%. Annualized, inflation takes this down to a 2.5% annual growth rate.

It’s as if COVID never happened

Teton County began its climb back from its Great Recession slump in the summer of 2013. Before COVID struck, Teton County’s total taxable sales peaked in February 2020. Between July 2013 and February 2020, in constant dollars taxable sales grew at a very healthy 6.4% annually – 2.5 times greater than our 25 year average.

What I find interesting is that if you extend the pre-COVID growth rate, today we’re basically at the same place we would have been had COVID not struck. A little lower, actually, but not far off the pre-COVID rate of growth. Which, in turn, was essentially the same inflation-adjusted rate of growth as during the previous growth cycles.

Two conclusions

Add it together, and two conclusions emerge.

First, when it’s growing, Teton County’s inflation-adjusted taxable sales growth rate averages between 5% and 6%. That’s a remarkably high and remarkably consistent pace of growth over the past two-and-one-half decades.

Second, from a taxable sales perspective, it’s almost as though the pandemic never struck.

Almost.

One thing that has changed since the pandemic is the mix of sales. Before COVID, businesses oriented towards tourists – lodging, restaurants, bricks-and-mortar retail (“B&M Retail” on the graphs below), and other tourism-oriented businesses – regularly accounted for around 58% of all taxable sales. During the pandemic, that figure dropped as low as 49%. Today, it is around 54%.

COVID’s toll + the Phoenix arises

As the graphs below suggest, our tourism industry got whacked during the first six-to-eight months of COVID, then rebounded sharply as both tourists came (especially during the summer) and prices shot up (especially during the winter).

Local spending saves the day

What saved our taxable sales bacon during the tourism slump was spending by locals, especially on constructing, remodeling, and equipping homes. That was greatly augmented by the rise of on-line shopping: In the summer of 2017, on-line sales accounted for 1% of Teton County’s total retail sales; today they account for around 20%.

Over the last year or so, there has been a noticeable drop in construction, car sales, and retail – both on-line and in locals-oriented bricks and mortar. While tourism numbers have shot up this summer – and with them tourism-related taxable sales – this growth has not been sufficient to boost overall sales. As a result, the local taxable sales economy is in a period of stagnation (in current dollars), if not decline (in constant dollars).

Particularly striking is the decline in construction-related sales, which in constant dollars are 6.4% lower today than they were a year ago. Unfortunately, the data aren’t available to figure out whether this is due to lower prices, a slowing pace of local construction, or some combination.

Nothing compares to property values

All of this pales in comparison, though, to the real elephant in the living room: property values. As robust as our various types of growth have been over the past decade, nothing compares to the growth in property values and, with them, property taxes. This is not only causing tremendous anxiety, disruption, and upheaval today, but for a variety of reasons will continue to do so in the future. Prominent among those reasons is that local government funding is tremendously reliant on sales taxes.

21st century community with a 20th century operating system

Why is this a problem? Because folks paying increasingly high prices for real estate are going to expect increasingly higher levels of service from their local government. To provide those services takes staff. To hire that staff takes revenue. And when the primary source of that revenue is growing slower than housing prices, it becomes increasingly difficult to hire the people needed to provide those services.

That fundamental structural imbalance – the dilemma I’ve labeled “a 21st century community with a 20th century operating system” is a topic for another day. For now, the first step in addressing the dilemma is to align our perceptions with reality – thanks for joining me on the journey.

Filed Under: Uncategorized

Our Region’s Future: Please Share Your Thoughts

September 6, 2023 By //  by cothrivejs

Hello, and happy September!

Diving right in, this newsletter involves an Ask and an Essay. Thank you in advance for considering the former and reading the latter.

The Ask

The Ask, part 1:

If you live in the Greater Tetons Region – whether full- or part-time – please follow this link to fill out the public opinion survey I am conducting. (Alternatively, you can also access the survey by scanning the QR code below.)
https://research-polls.com/sIwr

The Ask, part 2:

Please share the link with others. My goal is to get as many responses as possible before the survey closes on September 22.

The Why

Over the past year or so, I’ve heard a lot of concerns about where Jackson Hole and, more broadly, the Greater Tetons Region is headed.

How widespread are such perceptions? Rather than speculate, I developed and commissioned a survey to gauge residents’ views about the area and its future.

Gathering responses involves two phases.

Phase 1 just wrapped up. It was a random, statistically valid telephone survey of the region’s residents. (For the survey, I defined the Greater Tetons Region as Jackson Hole, Star Valley, and Teton County, ID.)

To get the broadest possible sense of residents’ attitudes, I’m launching Phase 2 – an all-are-welcome on-line version of the same survey. To take it, please click HERE.

As noted, my goal is to get as many residents as possible to complete the survey (it’s available in both English and Spanish). Hence the Ask.

The on-line survey runs from September 5-22, and I’ll present the initial findings at the September 23 kickoff conference for the Teton Leadership Center. It promises to be a great event, and you can register by clicking HERE.

I’ll also write about the survey’s findings in a future CoThive newsletter.

The Essay

Last month’s Republican presidential debate reminded me anew of how much I dislike election debates.

Local, state, or national, it’s all the same – in my view, debates offer little of value for anyone involved except, perhaps, the media and political professionals.

Why? Because debates reward behaviors and qualities which, at best, are unrelated to good governance. At worst, debates reward behaviors and qualities which are antithetical to good governance.

In this, debates distill the huge and growing disconnect between the qualities needed to be a successful candidate and the qualities needed to successfully govern. The result? Governing bodies filled with people who are great at getting elected, but awful at performing the job they were elected to do.

Why is this so and what might we do differently? I explore these questions in the essay below.

One Other Ask

Much of the funding for the work Charture does – this newsletter for example, or the public opinion survey I hope you’ll fill out – comes from charitable donations.

In Jackson Hole, it’s currently charitable giving season; specifically, it’s Old Bill’s Fun Run season.

For those of you not familiar with Old Bill’s, in 1997 a wealthy Jackson Hole couple partnered with the Community Foundation of Jackson Hole to create one of the nation’s most innovative non-profit fundraisers. Since then, it has raised over $228 million to support local non-profits, an average of over $8.8 million/year to help make Jackson Hole a better place for everyone.

Every Jackson Hole non-profit is eligible to participate in Old Bill’s Fun Run, and every dollar they raise up to $30,000 is matched by Old Bill’s donors (the match is usually around 50%).

Old Bill’s funding is vital to Charture’s operations. If you value this newsletter and our other work, please donate to Charture through this year’s Old Bill’s Fun Run by clicking HERE.

As always, deepest thanks for your interest and support.

Cheers!

Jonathan Schechter
Executive Director

PS – Please be sure to take our public opinion survey by clicking HERE or scanning the QR code below. Please also encourage everyone you know to do the same.

PPS – Please donate to Charture through Old Bill’s Fun Run by clicking HERE.

Scan this code to link to our survey. Let us know how you feel about the Greater Tetons Area and its future

The Great Campaign/Governance Paradox

“As the playoff race heats up heading into September, major league baseball has done the impossible: It has rescued itself from irrelevance — not through luck, but by identifying what was wrong about the way it was operating and having the guts to make fundamental changes.

“… If 147-year-old major league baseball can rewrite its rules to address its existential challenges, then maybe there’s hope that this even older and even more rule-bound country can do the same for issues with far bigger stakes.”
– Bryan Walsh; What America can learn from baseball (yes, baseball); Vox Magazine; September 1, 2023

Here’s my dream: We can have better government.

I say this as someone who has spent nearly half of the last three decades serving as a local elected official: 8+ years on the board of St. John’s Health; 4+ years on the Jackson Town Council.

From this perch, I’ve come to believe a fundamental problem – perhaps the fundamental problem – with government at all levels is not who we elect, but how we elect them. In other words, our governance system is a mess because our hiring process is a mess – particularly at the state and federal levels.

In a nutshell, here’s the problem.

  • The skills discrepancy
    • Being an effective candidate for office requires a certain set of skills.
    • Being an effective elected official requires a different set of skills.
    • Unfortunately, the skills you need to be an effective candidate arguably harm your ability to be an effective elected official, and vice-versa.
  • The consequences
    • Our elections identify and reward people who are good at running for office. What they do not do is identify and reward people who can actually govern.
    • As a result, we end up with governing bodies stocked with people who can’t or won’t govern, creating governing bodies that don’t work well.
  • Bonus observation: all of this is made dramatically worse by the current media environment – especially social media.

Context

I hold two firm beliefs about our community, nation, and planet.

First, we as a species can be no healthier than our ecosystems.

Second, we as a society can be no healthier than our institutions.

These two beliefs frame my professional and political careers. In both, my ultimate goals are to help us preserve and protect our area’s ecosystem, and to ensure well-functioning institutions.

In this context, it’s been disheartening to see – heck, it’s been disheartening to live through – the steady erosion of faith in our institutions. And not just government. Every year, Gallup asks Americans about their confidence in institutions ranging from the federal government to organized religion; from big business to public schools. Since peaking in the early 2000s (around the time of 9/11), Americans’ confidence has declined in every institution in Gallup’s survey.

Most strikingly, between 2002-2023 the four institutions experiencing the biggest drops in confidence were:

  • Newspapers (a 49% drop during that time, down to 18%)
  • the Presidency (a 55% drop, down to 26%);
  • TV news (a 60% drop, down to 14%); and
  • Congress (a 72% drop, down to 8%)

To me, the four are inextricably linked through the process of how we elect people to office.

Running v. serving

Running for office and being in office are very different worlds. For example, how does each define success?

In elections, that’s clear: Success equals winning. It’s an easy metric. It’s also a metric which – like that of a baseball game – can be easily understood and endlessly evaluated both before and after the event. And just like sports, campaigns are perfect fodder for all flavors of media – conventional and social.

Also like any sport, running for office is a zero-sum game: Either I win or you do. Therefore, my job is to get a whole bunch of people – few of whom actually know me – to either vote for me or, as importantly, to vote against you.

How do I do that? By drawing attention to myself through soundbites. Controversy. Hot-button assertions. Attacks on my opponent. Focusing on bright shiny objects. Emphasizing noise over signal. A host of stuff perfectly aligned with social media.

Some people are very good at these things. In politics, we increasingly reward them by electing them to office.

What about when you win? What is success for those in office? Defining that is much murkier. If it’s passing legislation, that requires a very different set of skills than winning an election.

In particular, while the goal in both elections and passing legislation is to get 50%+1 of the votes, the two different goals require two very different paths. For example, to succeed in elections many candidates opt to attack their foes. Try that when you’re in office, though, and all you’ll do is alienate someone whose vote you need.

Similarly, elections place a premium on playing a short-term, tactical game. In contrast, success in governance requires long-term thinking, for the legislative process is anything but quick. Further, as that long-term process plays out, you need to keep your eye on the prize, even if that means not drawing attention to yourself.

The list goes on and on, and it results in the great paradox of our system of governance: If I act in a campaign as I must act to succeed as an elected official, I probably won’t get elected in the first place.

The problem

The great campaign/governance paradox is perfectly distilled in our political debates.

For example, consider last month’s shout-fest between eight Republican presidential candidates. The event rewarded those candidates who preened for the cameras and studio audience, talked over the other participants, threw out zingers and soundbites, and generally did whatever they could to attract attention to themselves and/or make their opponents look bad.

What spoils did the victors enjoy? Media attention. The media lapped it up because, as with sporting events, dissecting debates and campaigns is an easy way to fill up space and generate buzz. The political class likes it too, because their job is to provide succor to candidates who, during campaigns, are among the most profoundly insecure people in the world.

Where debates fail – and fail hugely – is in serving democracy. In serving the governance process. In serving you and me. What those two hours of debate did not do is give us any sense of whether the candidates could actually govern. Could actually make government work. Could do anything to make society work.

On a larger level, the same is true of campaigns in general. In that vein, what really worries me is the growing body of evidence suggesting that, at all levels of government, we are electing people who are tremendous at running – tremendous at drawing attention to themselves by saying outlandish things, hurling scurrilous charges, and otherwise ginning up controversy – but have no interest in actually governing.

Hence, if they win, what do they do? Keep campaigning. And what do they not do? Govern.

This is governance as Kabuki, a stylized performance whose purpose is not actual governance, but getting re-elected. Our political system rewards not the abstractness of governance, but the concrete reality of elections. As a result, for that growing number of folks whose primary goal is getting re-elected, they find that the best use of their time in office is not to govern, but to basically keep the campaign going. It’s less work, less risk, draws more attention, and has a much bigger pay-off.

Unfortunately, as more elected officials take a transactional approach to office and prioritize their interests over those of the governing body, society pays the price of an increasingly dysfunctional government. The net result? A steady decline in the confidence people have in their government. Which, of course, only makes it that much easier to run against the system. And so the downwards spiral builds upon itself.

A partial solution

So what to do?

The essence of my suggested change is to do all we can to make campaigns focus on the job we actually elect officials to do: govern.

It’s pretty simple, actually. Let’s do all we can to highlight candidates’ governance-oriented skills while working equally hard to reject things that don’t matter to the governance process.

Sadly, on a national level, we can’t do much. Locally, though, we have two levers for making change.

Lever 1: Candidate Debates

Debates are one of the rituals of local campaigns. Candidates face a panel of reporters and are asked questions about things the media think are important. While such questions tell us a lot about local media’s priorities, for two reasons they rarely shine any light on candidates’ ability to govern.

Reason one is the nature of issues. For the most part the issues raised in debates are either essentially unsolvable – think housing or traffic – or ephemeral: e.g., last fall’s non-issue of “Save the Fairgrounds.” As a result, during debates candidates tend to end up sounding pretty much the same.

Reason two is that, because they come and go, issues are not really what matters. Instead, over the course of a term in office, what really matters is an official’s ability to effectively address the issues that arise.

To that end, we should be asking candidates not what they care about, but whether they understand how government works. Not how they would address a particular issue, but how they would get their colleagues to support their proposed solution. Because if they can’t get a majority of their colleagues to vote with them, nothing will get done.

As an alternative to the current system, my suggestion is to conduct what I call the “Free Market Debates.” By this I mean that organizers should devote most of a debate’s time to letting candidates talk about whatever they think is important. Don’t ask candidates about issues. Instead, ask them what they feel is important for voters to know and let them rip. Or blather. Or whatever they might do.

What the candidates say and, critically, what they don’t say will give voters far more insight into the candidates than anodyne responses to questions about intractable issues.

In the same way that all markets need some structure, though, Free Market Debates should not be entirely free form. Instead, specific questions should be asked about candidates’ understanding of the governance process, their governance experience, and their ability to get things done within the system.

We should also tell the candidates well in advance what the agenda will be. Why? Because the kinds of surprise questions that make debates feel like game shows have zero connection to governance.

The game show-cum-sporting event approach to debates emphasizes surprise questions because they add drama and intrigue to the spectacle. But do you know what governance rarely involves? Surprise. Drama. Intrigue. Instead, for the most part governance involves studying lengthy reports well in advance of a meeting, asking detailed questions, and being willing to wait if it’s too soon to make a decision.

Dull stuff, but this slow, plodding process is the warp-and-woof of governance. And what’s not required to succeed in this dull environment – in fact, what works against succeeding in this slow, plodding process – is the ability to quickly come up with sound bites, zingers, and glib responses.

So why structure debates in ways completely unrelated to governance? Elected officials know well in advance what issues they’ll be hearing. Let’s have our debates reflect that reality.

Lever 2: Candidate profiles

The second lever is basically a print version of the first.

Currently, during debates reporters ask candidates about issues the media think are important. Newspaper and web-based candidate profiles do the same. Because issues are usually complex, and because space is usually limited, the almost-inevitable result is that candidates provide answers which make them all sound pretty much the same. Worse, the questions posed never ask about a candidate’s understanding of the job, nor their ability to govern.

Instead, let’s structure candidate profiles so that candidates use the space to identify their priorities. Let’s also ask the candidates what they know about governance and the realities of the job. This will allow voters to focus on who will make a good elected official and not just a good candidate.

Conclusion

We can’t change human nature. As a result, candidates will continue to attack each other, raise phony issues, and otherwise continue to do all the other things that make campaigns so painful for candidates and voters alike.

We also can’t change the national political system. As a result of that, we will continue to suffer through our current– and thoroughly dreadful – politics as game show/sporting event approach to elections.

Locally, though, I believe we can do better. Know we must do better. Just like baseball, we know the problems. And just like baseball, we can find the guts to change. For the same basic reason – it’s the right thing to do to save an institution we so desperately need.

Filed Under: Uncategorized

Charitable Giving: What We Give; What We Might Give

July 25, 2023 By //  by cothrivejs

Hello, and happy mid-summer!

Over the past couple of months, I’ve enjoyed a lot of off-the-grid outdoors time. Re-entry’s been a slog, though, especially digging out from the seemingly bottomless pile of daily life stuff.

One of the many emails that fell between the cracks was from a long-time friend who raised an interesting question: Is there any way to track the effects of all the new money flooding into Jackson Hole over the past few years? Today’s newsletter is both an effort to answer that question and, more personally, to atone for not responding more promptly to my friend.

The essay below focuses on Jackson Hole’s charitable giving patterns. I chose the topic for four reasons:

  • It’s the only readily-available metric I know for gauging wealthy residents’ actions and priorities.
  • There is a deep and on-going debate whether the wealthy folks coming into Jackson Hole “get” the community. Are they as philanthropically minded as earlier generations of well-to-do Teton County residents? If so, are their donations a way of supporting Jackson Hole’s ethos and character? Or is their giving more akin to a modern-day papal indulgence?
  • There is a large and growing chasm between Jackson Hole’s economy and how we fund government. As a result, there is a large and growing chasm between what local government can afford to do and what the community wants it to do. Unless and until Wyoming alters how local government is funded, the level of services enjoyed by the community will increasingly be a function of philanthropic giving.
  • Locally, ‘tis the charitable giving season: Teton Valley’s annual Tin Cup race was two weeks ago, and Jackson Hole’s annual Old Bill’s Fun Run is coming up in six weeks (click HERE for more information; click HERE to go to the Donations page – donations can be made from August 11 – September 15).

The essay below is structured around my three major findings:

  • Teton County’s income and giving patterns are completely dominated by the well-to-do, particularly their non-wage income.
  • Over the past few years, as Teton County’s wealth has increased, so have its charitable giving metrics. Less clear is whether the growing metrics reflect an actual increase in giving or are simply statistical anomalies.
  • While Teton County leads the nation in some key charitable giving metrics, others suggest residents have the capacity to donate several hundred million additional dollars each year.
  • Teton County’s income and giving patterns are completely dominated by the well-to-do
  • Coincident with Teton County’s influx of wealth has been an increase in charitable giving
  • Teton County appears to have the capacity for far greater charitable giving than current levels

One final thought

One final note. Although my research focuses on Teton County, WY, my strong hunch is that the same basic trends are playing out in every other desirable place to live. For readers living outside Jackson Hole, are you seeing similar patterns in your communities?

As always, deepest thanks for your interest and support.

Cheers!

Jonathan Schechter
Executive Director

Teton County’s income and giving patterns are completely dominated by the well-to-do

Since 2010, for every county in America, the IRS has reported a wide variety of income tax data (the most recent year is 2020). Not just the number of returns filed and total income, but other tidbits such as how that income is earned, charitable deductions, and total tax liability.

The IRS also breaks tax returns into income categories, the highest of which is households reporting an Adjusted Gross Income (AGI) of $200,000 or more. To make the nomenclature easier, I’ll refer to these as “high-income households,” and those earning under $200,000/year as “lower-income households.”

Before getting into the analysis, two caveats:

  • While the IRS data show total itemized deductions claimed for charitable giving, they do not show where that money went; i.e., how much was donated to Teton County non-profits, and how much was donated outside Teton County. (The data also exclude donations not claimed as a deduction, which history suggests is a small percentage of the overall total).
  • Federal tax reform legislation passed in 2017 significantly lowered the tax benefits of charitable donations for everyone except the ultra-wealthy. The consequences became evident in 2018’s tax return data, and have remained that way since.

2010

In 2010, 12,833 Teton County, Wyoming households filed an income tax return. Their total AGI was $2.76 billion, yielding a mean per-household income of $215,305. This was the nation’s second-highest per-household income, trailing only Billings County, North Dakota (which enjoyed a one year income spike thanks to being located at the heart of the Bakken fracking boom).

That same year, 944 of Teton County’s households – 7% of the county’s total – were high-income households. Collectively, those households earned $2.22 billion, which accounted for 80% of residents’ total AGI. Their mean household AGI was $2.35 million.

Also in 2010, Teton County had 11,889 lower-income households, 93% of the total. Collectively, they earned $541 million, or 20% of the county’s total. Their mean household AGI was $45,521.

2020

In 2020, 14,700 Teton County households filed an income tax return, a 15% increase from 2010. The county’s total AGI was $6.70 billion, 142% more than ten years earlier. Teton County’s mean per-return income was a nation-leading $455,855, 112% higher than in 2010.

That same year, 2,440 Teton County’s households – 17% of the county’s total, or one out of every six households – were high-income. Those households earned a combined $5.99 billion, 89% of residents’ total AGI. Their mean AGI was $2.46 million, 4% higher than in 2010.

Also in 2020, Teton County had 12,260 lower-income households: 83% of the total, or five out of every six households. Collectively, these households earned $708 million. Although this was 31% more than in 2010, the lower-income households’ share of the county’s total income fell from 20% to 11%. In 2020, the mean AGI of lower-income households was $57,746, 27% more than in 2010.

2010-2020

Between 2010 and 2020, essentially all the growth in Teton County’s households and income occurred among the well-to-do – high-income households accounted for 80% of the county’s household growth and 96% of its income growth.

In both 2010 and 2020, the mean income of Teton County’s high-income households was about 50 times greater than the mean income of its lower-income households. In both years, that disparity led the nation.

To put Teton County’s wealth disparity into context, in 2020 Teton County had 2,440 high-income households. Collectively, they earned $5.99 billion.

In contrast, between 2012 and 2020 a total of 111,570 Teton County households earned under $200,000. Collectively, those lower-income households reported a total AGI of $5.83 billion.

Compare the two, and in 2020 – in just one year – Teton County’s 2,440 high-income households made more money than over 111,000 Teton County lower-income households combined made during the nine years spanning 2012-2020. To grossly understate the case, that is an impressive amount of wealth concentration.

Why the great disparity? In part it’s because Teton County’s high-income households not only earned much more income than the rest of the community, but a different kind of income.

In particular, as the graph below shows, the bulk of all the income earned by Teton County lower-income households comes from wages and salaries. Further, for those households “non-wage income” is primarily pensions.

It’s just the opposite for high-income households, who make the vast majority of their income from non-wage investments.

Coincident with Teton County’s influx of wealth has been an increase in charitable giving

Because tax law incentivizes the well-to-do to make charitable contributions, tax return data on charitable donations is dominated by high-income households. For example, for the US as a whole in 2020, high-income households were responsible for $136 billion of the $193 billion Americans claimed in charitable donations: 71%. In Teton County, the figures were $416 million of the $422 million total: 99%.

Ten years earlier, the situation was much different. In 2010, high-income homes accounted for just 40% Americans’ total itemized charitable deductions: $68 billion out of $169 billion. In Teton County the figure was 97%: $248 million out of $257 million.

The cause of the change was 2017’s “Tax Cuts and Jobs Act” which, in the words of the Tax Policy Center, discouraged charitable giving by reducing “the value and incentive effect of all tax deductions… raising the after-tax cost of donating by about 7 percent. Unless taxpayers increase their net sacrifice – that is, charitable gifts less tax subsidies – charities and those who benefit from their charitable works, not the taxpayers, will bear the brunt of these changes.”

The law certainly had an effect on Teton County.

As the graph below shows, from 2010-2017, each year an average of 86% of Teton County’s high-income households claimed deductions for charitable giving. From 2018-2020, the average dropped to 60%.

Interestingly, the law did not seem to affect total itemized donations, which were flat between 2017 and 2018, then spiked in 2019.

Put the two together, and for the past 11 years, annual mean donation figures have bounced all over the place. This is because any one year’s charitable deduction claims can be wildly influenced by the actions of just a few tremendously wealthy households.

Sadly, this variability makes it hard to draw any firm conclusions about how either the 2017 tax law or the 2020 COVID in-migration affected Teton County’s giving patterns. To try to work around this problem, I combined the data into two larger time periods: the three years before the act took effect (2015-2017) and the three years following (2018-2020).

2015-2017

Between 2015-2017, Teton County’s high-income households had the nation’s second-highest mean per-return household AGI: $1,788,883. (We would have been first had a few residents of the lightly-populated Dixie County, FL not enjoyed a one-time, one-year income surge.)

During that same period, our $128,040 mean per-return donation figure was also second in the nation, trailing only Benton County, Arkansas’s $135,989. (Benton County is the location of Walmart’s headquarters.)

Where we lagged was in donations as a percent of total AGI. During those three years, our high-income mean donation rate 7.2% of AGI ranked us 54th in the nation. In contrast, Benton County’s well-to-do citizens gave 13.2% of their income to charitable causes, ranking them 3rd nationally.

2018-2020

Things were different for the period 2018-2020.

During those three years, Teton County led the nation in high-end income, with a mean AGI of $1,983,033. This was 11% more than in 2015-2017

What’s striking is that during the three years following the “Tax Cut and Jobs Act,” Teton County’s high-income households actually claimed a higher level of charitable deductions than they had in the three previous years.

In particular, during 2018-2020, Teton County’s mean charitable deduction rose to a nation-leading $167,659, 31% more than in 2015-2017. Further, those donations represented 8.5% of Teton County’s total high-end income, 10th highest nationally and an 18% increase over the earlier period’s 7.2%.

As a result, while we can’t say anything specifically about COVID’s effects on charitable giving, at first blush it seems that over the past few years, local charitable giving has surged. While I hope that’s the case, the underlying explanation may be far more prosaic – a function of basic math rather than a more charitable mindset.

A huge mathematical caveat

Between 2015-2017, an average of 86% of America’s high-end households claimed a deduction for charitable donations. Between 2018-2020, that figure fell to 46%.

For Teton County, the figures were 82% and 60% respectively.

The basic reason for these declines was that, for all but the very wealthiest Americans, the “Tax Cut and Jobs Act” reduced the incentive to take charitable deductions. As a result, the people who continued to claim charitable deductions tended to be those making the most money. Which was, of course, a large and growing element of Teton County’s population.

This change in incentives discouraged a lot of lower-income folks from making – or at least itemizing – charitable donations: In 2017, 18% of Teton County’s lower-income households itemized their charitable donations; in 2020 that figure was 6%. Even among the well-to-do, the changes hit hard: in 2017, 82% of Teton County’s high-income households itemized their charitable donations; in 2020 that figure was 57%.

As a result, starting in 2018 the pool of people claiming charitable donation tax deductions became much more concentrated at the higher end than it had been before. Do the math, and the inevitable result is a higher overall average.

Here’s an example. Imagine that, in 2017, five households each itemized their charitable donations. The biggest donation was $34; the rest were $26, $18, $12, and $10. The total amount donated was $100, an average of $20/donation.

Now skip ahead a year. Keeping everything else the same except the tax law changes, there was no longer any incentive for 2017’s smaller donors to itemize their donations (and perhaps not donate at all). Eliminate those bottom two donations, and the total amount given falls to $78. The mean donation, however, rises to $26.

It seems likely something similar happened in response to the “Tax Cut and Jobs Act”: those well-to-do Teton County residents who continue to claim charitable donation deductions were those who made more money and larger donations. It also helps explain why the number of high-income households rose more sharply from 2018-2020 – 16% – than did the number of high-income households claiming charitable deductions: 6%

What this argument doesn’t explain why overall donations rose, but there again annual donation figures are subject to pretty big swings.

Teton County appears to have the capacity for far greater charitable giving than current levels

As noted above, in the years 2018-2020, Teton County’s high-income households led the nation in mean annual giving, with a per-return figure of $167,659. In a distant second place was Benton County, Arkansas, at $127,584.

Where Benton County’s high-income households had a leg up on Teton County was in the proportion of total income they donated to charities: a nation-leading 13.5%, versus Teton County’s 10th place 8.5%.

Benton County’s high-income households also led the nation in their proportion of non-wage income donated to charities: 19.4%, essentially double Teton County’s 60th-place 9.8%.

Viewed through this lens, it suggests that while Teton County has a strong culture of charitable giving, it also has the capacity to give more. A lot more.

Specifically, if in the three years between 2018-2020, Teton County’s high-income households had donated the same percentage of their total AGI as did Benton County’s, Teton County residents would have donated an average of an additional $226 million each year to charitable causes – 59% more than they actually gave.

Similarly, had Teton County high-income residents matched Benton County’s percentage of non-wage AGI, they would have donated an average of an additional $369 million per year, an increase of 97%.

Before going any further, two observations.

First, it’s easy for me to say “they could have donated a lot more” because it’s not my money.

Second, as noted earlier, even if Teton County’s well-to-do donated more, there’s no guarantee the money would be donated to Teton County non-profits.

Still, while it’s clear that Teton County has historically cultivated a culture of giving, due to the annual vagaries of giving patterns and the timing of the “Tax Cuts and Jobs Act,” it’s not clear whether that giving culture has been embraced by the influx of residents who’ve arrived in the past few years. We can hope it has, but unfortunately the data won’t settle the debate.

Donations as a percentage of income

So what might give clarity? What might be a clear indicator that new arrivals have embraced Teton County’s culture of giving?

Again, it ain’t my money, but I can think of no better measurement of our charitable giving culture than “Donations as a Percentage of Income.” In particular, the goal would be for Teton County to lead the nation in the proportion of income its high-income households donate to charitable causes.

Is this possible? Arguing for it is the fact that between 2010-2020, Teton County’s high-income households led the nation in mean per-return giving five times, ranked 2nd three times, and ranked either 3rd or 4th the other three years.

When it comes to “Donations as a Percentage of Income,” though, we’ve not done nearly as well. Specifically, between 2010-2020, the best we ever did is rank 3rd one year. In three other years we placed in the Top 25; in the remaining seven we didn’t even crack the Top 50.

Which is baffling, especially when you consider that Wyoming is America’s most wealth-friendly state. Given that, how is it that counties in less wealth-friendly states can donate so much more than we do? Especially when Teton County is the wealthiest county in the wealthiest country in the history of the world?

So which counties rank highest in average giving percentage? As a rule of thumb, they fall into one of two camps. One is lightly-populated counties in southern states, where large numbers of residents belong to evangelical churches. The other is counties in Utah and Idaho with high concentrations of members of the LDS church.

Teton County falls into neither category. Nor does Benton County, which makes it such a good place to compare ourselves to.

One final thought

Looking at the list of counties which rank highest in “Donations as a Percentage of Income,” it’s striking how living in an intensely religious environment can correlate with great generosity.

Without meaning to blaspheme the sacred, I’m also struck by how many people wax spiritual when they speak of the Tetons region. In that light, I can’t help but wonder whether the non-religious spirituality Jackson Hole evokes might lead Jackson Hole’s well-to-do residents to donate even more of their wealth to causes of their choosing – even in this community of abundance, the need is certainly there.

Many of our well-to-do residents have already made a mark on the world. How wonderful would it be if this extraordinary place can inspire people – especially those new to the region – to use their wealth to have an even greater effect on their community, region, nation, and world.

Filed Under: Uncategorized

The Great Disconnect: Tourists & Sales Taxes

May 15, 2023 By //  by cothrivejs

Hello, and happy Mother’s Day!

It’s mid-May, that magical time of year in the northern Rockies when, as the days become longer, you can practically see plants growing in real time. Especially after our exceptionally long and gray winter, the lushness is profoundly welcome.

Sadly, my outdoors time is constrained by the fact that it’s also government budget season. Wyoming’s governments operate on a July 1 fiscal year, so we in local government are deep into shaping our FY24 budget. The effort is particularly grinding this year, as we find ourselves between the rock of slowing revenue growth and the hard place of growing community desires.

Hence the focus of this newsletter: Trying to use a handful of basic local economic indicators to make some sense of Jackson Hole’s economic situation – past, current, and future.

Caveat emptor. For as much as I’ve tried to keep this essay simple, the section labeled “Data Geekdom” is just that. While I think it’s interesting, it’s been pointed out to me that my tastes are not always universally shared. Weird…

As always, deepest thanks for your interest and support.

Cheers!

Jonathan Schechter
Executive Director

The Great Disconnect

Among the local tourism community, there’s great concern that the summer of 2023 will be “soft.”

Driving this concern is the fact that advance bookings for July and August – the clearest predictor of visitors during Jackson Hole’s most important tourism season – are down double-digits from last year. They’re so far down, in fact, that some folks are speculating summer 2023 will the quietest in years, akin to the pre-COVID period of 2018 and 2019. During those years, taxable sales were 30% or more below current levels. (Figure 1)

Which raises an interesting question. How do we judge “soft”? More broadly, how do we determine “success”?

With both visitation and sales taxes, our default definition seems to be “growth = success.” In the case of the former, success equates to having more visitors. With the latter, it’s more taxable sales.

There’s also an assumption the two are linked: If we have more visitors, presumably we’ll have more sales. Fewer visitors, fewer sales.

Yet recent data suggest things might not be so simple, instead hinting at what we might call the Great Disconnect. In particular, between the summers of 2021-2022, even though visitation was sharply down, taxable sales were up: Yellowstone visitation was down 40%, Grand Teton visitation was down 26%, and Jackson Hole Airport enplanements were down 34%, yet taxable sales rose 1.1%.

How can that be? And regardless of the answer, were we successful? Or not successful? Or…

Finally, how do we judge success in light of what I heard from many people – including prominent tourism leaders – that they were secretly thrilled with how last summer played out. “I didn’t hit budget, but without all the tourists it felt like we had our valley back again,” one told me. “I’ll take that any day.”

Jackson Hole’s visitor numbers cratered last summer for two reasons: the Jackson Hole Airport was closed for around 90 days as it replaced its only runway; and parts of Yellowstone were closed for long stretches because flooding damaged its roads. Grand Teton National Park’s visitation suffered collateral damage from both.

Yet as I note above, taxable sales were up. The more I thought about it, the more I started wondering: “If sales taxes are driven by tourism, why didn’t 2022’s sales tax numbers plummet along with visitation?” Here’s what I discovered.

Visitors and Sales Taxes

How have we come by our definitions of success regarding taxable sales and tourism levels? Arguably by taking the path of least resistance.

On a monthly basis, the State of Wyoming measures sales taxes. Why? Because they are one of the state’s few sources of revenue. Sales taxes are especially important to local government, where they form the core of local government funding: Sales taxes account for around 45% of Teton County’s general fund revenue, and 75%-80% of the Town of Jackson’s.

So we measure sales taxes. Frequently, and at a granular level: The state’s monthly reports are county-specific, and they list the sales taxes collected in each county in each of 308 different business categories.

Similarly, because visitation statistics are critical to national park management, every month both Grand Teton and Yellowstone report visitor counts. Similarly again, because enplanement counts are critical to airport service, every month the Jackson Hole Airport reports commercial airline enplanements.

Thus we arrive at the four measurements that form the basis of how we evaluate success: sales taxes, Grand Teton and Yellowstone visits, and Jackson Hole Airport enplanements. Are these metrics are the best way of evaluating the community’s economic success? That’s debatable. Are they the easiest way of evaluating the community’s economic success? That’s indisputable.

Wyoming has been reporting sales taxes at the aforementioned level of granularity for over a decade, so the next few figures look at these metrics for the period starting in 2012.

For the years 2012-2022, Figure 2 shows the annual counts for our three major visitation statistics, as well as their compounded annual growth rates. Of the three, only the Jackson Hole Airport’s activity was growing before COVID hit. (Note: the fuchsia lines show growth from 2012-2022.)

Figure 3 shows taxable sales during the same period.

Before analyzing the graph, two methodological points.

First, many of the following graphs show constant dollars; i.e., each year’s dollar figures are corrected for inflation.

Second, to try to get a better handle on this “What’s causing the Great Disconnect?” question, I combined the 308 business categories into two macro-groupings: Tourism-Related and Non-Tourism-Related. The former includes all Lodging, Restaurants, Rental Cars, Tourism-related Retail such as clothing, sporting goods, and gift stores, as well as a hodge-podge of other tourism-oriented categories. The latter includes everything else. And while I’m acutely aware it’s an imperfect system (e.g., locals go to restaurants, buy sporting goods, and the like), at a minimum if offers a consistent approach for analyzing the data over time.

Using this construct, Figure 3 offers two important insights:

  • Since 2012, Non-Tourism-Related sales have grown faster than Tourism-Related sales.
  • While Tourism-Related sales dropped 20% during COVID, Non-Tourism-Related sales rose 11%. As a result, for the first time in history, in 2020 Non-Tourism taxable sales eclipsed those related to tourism.

Add it all together, and we get a sense of why our taxable sales economy weathered the COVID downturn far better than anyone anticipated: Locals picked up the slack.

Probing Deeper

But how exactly did locals pick up that slack? Digging a little deeper, a clearer picture emerges.

Figure 4 shows the same data as Figure 3, but on a monthly rather than annual basis. The figures show 12 month running totals, and again I’ve corrected for inflation.

By presenting monthly data I can also extend the analysis to March 2023. This is important because as Figure 4 makes clear, for the past six months or so Jackson Hole’s taxable economy has been stagnant (particularly when inflation is taken into account).

What’s striking about this is that the past six months includes our just-completed epic winter. Yet despite record snowfall, Jackson Hole’s taxable economy was flat.

Why? How can we – ostensibly a “ski town” – enjoy the best snow in decades yet not see any gain in taxable sales? Was everything in the doldrums, or just some sectors?

To answer that question, Figure 5 looks at the four components of my Tourism-Related macro-grouping. From a revenue perspective, local lodging hit its peak at the end of the 2021-22 ski season, and has been in decline since.

This seems to be a function of two things. First, while last year’s snowpack paled in comparison to this year’s, what matters is not the absolute amount of snow we get, but how much we get relative to other ski areas. Our snow last year may not have been epic, but innkeepers apparently took advantage of the fact that it was a whale of a lot better than anywhere else in the western US.

Second, last summer the decline in the number of tourists resulted in less demand for hotel rooms and/or lower prices.

Restaurants and Retail weathered the decline in tourism numbers better than Lodging, which may be due to the fact that, while locals rarely rent hotel rooms, they frequently eat out, buy sporting goods, and the like. Using similar logic, many of the industries in “All Other (Tourism)” tend to focus on tourist-oriented activities (e.g., car rentals, scenic tours, and the like).

Two things jump off of Figure 6, which shows the Non-Tourism-Related categories of local taxable sales.

First, Construction.

At the beginning of 2013, Construction-related taxable sales (the green arrow) totaled less than Non-Tourism Retail and All Other taxable sales. Today, Construction sales are over 40% higher than both.

But the real story is Teton County’s boom industry: On-Line Shopping (the fuchsia arrow).

In 2017, Wyoming started demanding that on-line merchants charge sales tax. Five years later, we’ve reached a point where, today, on-line purchases by Teton County residents generate about as much in sales taxes as do their purchases from local stores catering to locals’ needs.

During COVID, On-Line sales nearly doubled. Those sales, along with a spike in Car Sales, saved our taxable sales economy from the worst economic consequences of the pandemic.

Looking Ahead

The striking thing about both Figures 5 and 6 is that, since last autumn, none of the nine sales categories has grown. Most have fallen, and even On-Line Shopping, that most reliable generator of local sales tax growth, has been stagnant for the last several months.

So what might the future hold?

To repeat a point from above, there is a concern among local tourism mavens that this coming summer looks soft. But if last year showed we can enjoy modest sales tax growth even in the midst of cratering tourism number, how big a concern is that?

Unfortunately, I fear it’s a non-trivial concern. I say this because each time tourism revenues have turned down over the past decade, that slump has occurred at a time when Construction, On-Line Shopping, or both have been growing. Today, though, taxable sales related to Construction are declining, and On-Line Shopping is stagnant.

This matters because, to repeat another point made earlier, local government in general, and the Town of Jackson in particular, is highly dependent on sales tax revenues. When combined with the money received from various federal stimulus programs, the past few years’ surprisingly high sales tax figures have allowed local government to address a lot of wants and needs. As the stimulus funds dry up, though, a simultaneous slowing of sales tax revenues will make for some difficult funding discussions.

Data Geekdom

One other note.

Several years ago, I noticed that the graph line of local taxable sales looks a lot like the graph line of the S&P 500 Index (Figure 8).

When I dove into it, I discovered not only that they look alike, but that the S&P 500 can be used to estimate future taxable sales.

A basic tenet of statistics is that correlation is NOT causation, and I’m NOT saying changes in the S&P 500 cause changes in local taxable sales.

What is striking, however, is that there’s a clear correlation between the two, one that can help us see where local taxable sales might be heading.

The foundation of my statement is a metric called “R squared,” which quantifies the correlation between two data sets.

R squared values fall between 0 and 1, and 0 means the two data sets have no relationship to each other (e.g., there is no relationship between someone’s shoe size and the number of jellybeans in a jar).

In contrast, an R squared value of 1.0 means the two data sets have a perfectly correlated relationship.

An R squared of 0.7 is considered strong. An R squared of 0.9 and higher is extraordinarily strong, and that leads us to Figure 8.

Figure 8 looks at the relationship between the S&P and local taxable sales over four different time frames, each rooted in a date when we saw a significant shift in local taxable sales patterns.

Along the X axis, I compare today’s taxable sales figures to the S&P 500 values ranging anywhere between 0 and 25 months ago. The Y axis shows the corresponding R squared value.

What I found was that, particularly for the longer-term time frames, there is a remarkably close relationship between where the S&P 500 Index was a while ago, and where Teton County’s taxable sales are today. Even in the “worst case,” the R squared values are above 0.7.

The single strongest r-squared value I found was one of 0.972 – an essentially perfect correlation – when I used the June, 2005 dataset, and offset the S&P by 11 months. What this tells me is that it’s highly probable that, one year from now, our taxable sales will be at about the same level as they are today. (Figure 9)

Conclusion

The tight correlation between the S&P 500 and local taxable sales stands in sharp contrast to what seems to be the increasingly loose relationship between Jackson Hole’s visitation numbers and our taxable sales.

So what’s going on?

It’s not entirely clear, but as Figure 10 suggests, particularly over the past several years, a second, complementary engine seems to have emerged to power Jackson Hole’s taxable sales growth: growth itself. Growth in construction spending. Growth in consumer goods. Growth seemingly commensurate with the amount of wealth pouring into the community. In fact, growth in consumption that’s even greater than residents’ income growth.

Some of this has to do with construction, of course, which is such a hugely expensive proposition. But when locals’ per capita Non-Construction spending is also growing faster than income, it suggests Jackson Hole may be embracing an ethic of consumption for consumption’s sake. If true, that strikes me as something new to this community.

Whither tourism?

Is tourism still important to Jackson Hole? Absolutely. And at a lot of levels. For example, from a selfish perspective, every dollar of sales tax I pay to fund our government is being matched by a dollar paid by a tourist.

But a decade ago, it was more like every $4 of sales tax I paid was being matched by $6 paid by tourists. That’s an interesting, and non-trivial, shift.

For a while now, tourism has been evolving as an industry. And as with so many other aspects of our life, COVID poured gasoline on the pace and magnitude of that evolution.

Locally, part of the evolution is linked to the growing number of well-to-do people moving to Jackson Hole. Few of these newcomers have direct financial connections to tourism, leaving them less invested in its success.

Looking ahead, another critical part of the evolution will be driven by the fact that, increasingly, Jackson Hole is pricing out our traditional summer tourist.

Echoing what’s happened with Jackson Hole’s housing market, as lodging rates go up, lower-end consumers are priced out. In that environment, businesses that can evolve to serve a higher-end clientele will do so, charging ever-higher prices for to an ever-smaller group of customers.

But what of those businesses which depend on the mass market? Whose success lies in selling a large quantity of goods at a lower price to lower-end customers? Those business have traditionally served national park visitors, complementing the Park Service’s mission to serve every American. Yet what happens to Grand Teton’s visitation when large numbers of people can’t afford to stay in Jackson Hole? And what happens to Jackson Hole’s tourism economy? These, and related questions, are yet to be answered.

Over the past few decades, Jackson Hole has built up a remarkably sophisticated tourism industry, investing hundreds of millions into a tourism ecosystem that has managed to strike a successful balance between the needs of commerce, the needs of the community, and the needs of our environment.

The economic realities underlying that balance are shifting rapidly, though, creating arguably unprecedented uncertainties for the industry and community alike. To loop back to the beginning of this essay, it seems likely we will no longer be able to determine “success” by simply growing our visitor count and increasing sales tax revenues. Instead, the clearer we can be in creating a holistic definition of success – one encompassing not just a handful of basic economic measures, but also metrics focused on our community and environment – the more successful our future will be.

Filed Under: Uncategorized

Billionaires Driving Out Millionaires

April 4, 2023 By //  by cothrivejs

Hello, and happy Spring (or at least Spring Break)

Tax day looms. In an effort to further my brand, I’ve gone down a rabbit hole of analyzing income tax data. You, dear reader, are the lucky beneficiary of my efforts.

In particular, I’ve been using IRS data to explore two questions: “As the cliche goes, are Jackson Hole’s billionaires driving out its millionaires?” and, if so, “How did COVID affect things?”

Three recent occurrences sparked this research.

The first was a poignant comment my son recently shared with me. Born and raised in Jackson Hole, he observed: “These days, when I hear about my hometown, it’s no longer that the Tetons are a really cool place. Instead, it’s that Jackson Hole has become a caricature of extreme wealth.”

The second was a conversation with a venture capitalist. Recently arrived in town, my new friend shared several observations about our fair community. He caught my ear by remarking that we need to construct two tunnels – one “between Jackson Hole and Idaho Falls;” the other “between Teton Village and Jackson Hole.” More comprehendibly, he noted that “if wealthy people stop liking it here, they’ll move to Montana or some other place.”

Finally, he also acknowledged that the wealth moving into Jackson Hole is causing a lot of problems, and potentially permanently damaging the community. However, “…that’s just how it goes in America.”

The third occurrence was a Wall St. Journal poll asking about five core values. The results showed steep declines in support for four traditional pillars of American life: patriotism, religion, having children, and community involvement. The only value gaining traction was money: In 1998, 31% of respondents said money was “very important;” in 2019, it was 40%; today it’s 43%.

Combined, the poll results and the two sets of comments neatly distill the concerns I’ve been hearing about the greater Tetons region – folks are increasingly worried that our sense of community is eroding, falling victim to a growing focus on that lowest of all common denominators: money.

Is that the case? Obviously IRS data can’t answer that directly, but they did allow me to conclude that, in both Jackson Hole and our peer “lifestyle communities,” the cliche has merit: the newly-arriving billionaires are metaphorically driving out the millionaires. Further, COVID did throw gasoline on that fire.

Equally interesting, the same phenomenon is happening – albeit at lower dollar figures – in not just lifestyle communities, but in “lifestyle suburbs;” i.e., the regions surrounding the lifestyle communities. There, in places like Wyoming’s Star Valley and Idaho’s Teton Valley, newly-arrived residents are making more money than longer-term residents. In turn, this new wealth seems to be pushing out those lower down on the income scale.

I think these findings are both interesting and important, especially because the influx of wealth is at the core of every challenge facing not just Jackson Hole, and not just the Tetons region, but every desirable place on Earth to live.

Further, I don’t see the underlying dynamics changing. Indeed, the data confirm my strong sense that, in desirable places around the country, socio-economic-driven changes are accelerating in both pace and magnitude. As they do, once-distinctive places are seeing their cultures become increasingly homogenized; their class structures become increasingly income-stratified. In turn, all this is wreaking havoc on the sense of community, leaving long-time residents reeling.

Below, this very lengthy newsletter shares the results of my digging. Thanks in advance for working through it, and I hope you find the information valuable.

As always, thank you for your interest and support.

Cheers!

Jonathan Schechter
Executive Director

Introduction

Annually, for every county in America, the IRS tallies how many households filed tax returns from the same county two years in a row, and how much total Adjusted Gross Income (AGI) those households reported. The IRS calls these “Non-Migrants.” It also reports the same information for households moving out of one county into another (In-Migrants) and vice-versa (Out-Migrants).

The analysis below looks at four geographies:

  1. Teton County, WY
  2. The Tetons region
  3. Wyoming
  4. Communities similar to Jackson Hole and, more broadly, national trends

The analysis emphasizes In-Migrant income because people with the highest incomes have the greatest freedom to live where they want to, rather than where they have to.

Teton County, Wyoming

Between 2010 and 2020, a total of 12,700 households moved into Teton County. 12,197 moved away, a net gain of 503 new households over 10 years.

In some years, there were more In-Migrants than Out-Migrants; in other years, it was the opposite. In a typical year, 11.4% of Teton County’s households had lived elsewhere the previous year, and 10.9% moved somewhere else. The net result was a modest annual gain of 0.5%. (Figure 1)

Far less modest were the income differences.

In 2010, Teton County’s 8,569 Non-Migrant households had a mean AGI of around $78,000. The 903 households moving into Teton County had a mean AGI of around $106,000 – 36% higher. The 1,032 households moving away had a mean AGI of around $42,000 – 46% lower than that of the Non-Migrants.

Over the subsequent decade, those figures varied. In most years Teton County’s Non-Migrants had a higher mean AGI than did the newcomers. The only constant was that Teton County’s Out-Migrant households always had a much lower income than did In-Migrants.

Then, in 2020 – the beginning of the COVID migration – things went crazy.

That year, Teton County’s 1,275 In-Migrant households – the highest number of In-Migrants since 2014 – had a mean AGI of $661,001, more than twice the previous In-Migrant record of $316,910. It was also over twice the mean AGI of the county’s Non-Migrants, who enjoyed a nation-leading $305,357.

Meanwhile, those leaving the county in 2020 had a mean household AGI of $100,181 – over six times less than the In-Migrants’ income. (Figure 2)

To put the Out-Migrant figure in perspective, in 2020 the typical Teton County Out-Migrant household earned a lot of money – 15% more than the mean US AGI. Yet in a cruel coincidence, that $100,181 figure was also just 15% of the income earned by the typical In-Migrant household.

In 2020, Teton County led the nation in both mean Non-Migrant AGI and In-Migrant AGI: $305,357 and $661,001 respectively. Our Out-Migrant AGI of $100,181 ranked 49th, putting us in the top 2% of all US counties. (Figures 3, 4, and 5)

Because our In-Migrant income was so high, though, in 2020 – again, the first year of the COVID migration – In-Migrants to Teton County accounted for fully one-fifth of the county’s total income. The previous record had been one-eighth.

The bottom line? For many years, the incomes of those moving to Jackson Hole have been far greater than the incomes of those moving out. In 2020, the tidal wave of new In-Migrant money was so great that it completely overwhelmed the incomes of Jackson Hole’s Out-Migrants. Ominously, it also more-than-doubled the $305,357 made by Teton County’s Non-Migrants; i.e., the community’s locals.

Therein lies the evidence that, at least since COVID hit, Jackson Hole’s metaphorical billionaires have been displacing our metaphorical millionaires. Which begs an interesting question: Where are all those displaced millionaires going? To answer that, let’s look at regional trends.

Tetons Region

Here’s a rather astonishing statistic.

In 2020, Teton County, WY’s In-Migrants earned 20.3% of the county’s total AGI. This ranked us 5th nationally.

That same year, Teton County, ID’s In-Migrants earned 18.6% of that county’s total income, ranking it 11th nationally. In Lincoln County, WY – Jackson Hole’s other “bedroom community” – In-Migrants earned 14.5% of that county’s total income, ranking it 53rd nationally. (If it were possible to focus just on the Star Valley portion of Lincoln County, the percentage would be much higher).

In 2020, Teton County, WY’s In-Migrant mean AGI of $661,001 led the nation. That same year, Lincoln County’s typical In-Migrant household earned $148,508, ranking it 28th nationally. In Teton County, ID, the figures were $114,916 and 70th.

Where did our neighboring counties’ big-earning In-Migrants come from?

Not surprisingly, Teton County, WY accounted for the greatest number of In-Migrants to both Lincoln, WY and Teton, ID, accounting for 12% and 19% of new households respectively.

What’s interesting, though, is that those moving from Jackson Hole to Star Valley or Idaho’s Teton Valley weren’t those with the most money. Instead, those moving to Jackson Hole’s “lifestyle suburbs” from outside the Tetons region had much higher mean incomes than those moving within the region (Table 1)

Why would this happen? The data can’t answer this question directly, but I have a two-part hypothesis.

Part 1 is that younger, less well-off people priced out of Jackson Hole but wanting to stay in the region found they could afford housing in adjacent counties. Hence the lower mean incomes of those leaving Teton County, WY for our neighboring counties. These folks love our region, and are willing to do whatever they can to stay proximate to the Tetons.

Part 2 is that a number of well-to-do COVID migrants living outside our region wanted to move here, but found themselves priced out of Jackson Hole. The alternative? Move to neighboring counties.

Add it together, and two things are going on. First, Jackson Hole is pushing its less well-to-do out to surrounding communities, who in turn are pushing their less well-to-do even further afield. Second, those who can’t afford Jackson Hole in the first place are choosing to go to its lifestyle suburbs, where the newcomers make more than extant residents.

Over time, these disparities will greatly increase the economic pressures facing our region, particularly for new housing. Even if scads of new units are built, though, the mounting economic pressures are so powerful that it will make it increasingly difficult for the less well-to-do to live not just in Jackson Hole, but anywhere in the greater Tetons region.

Wyoming

Wyoming is considered to be an “on-shore, off-shore tax haven,” the state with the most wealth-friendly income tax and trust laws in the nation.

Because these laws apply in each of Wyoming’s 23 counties, if all other things are equal, people should be similarly attracted to each county.

As Figure 6 illustrates, though, all other things are not equal. Not even close.

In 2010, the average Teton County In-Migrant household earned $105,850. This was highest in the state and third-highest in the nation.

That same year, Wyoming’s lowest figure was in Albany County. There, the average In-Migrant household earned $30,538, 29% that of Teton County

In 2020, the average Teton County In-Migrant household earned a nation-leading $661,001. That same year, Wyoming’s lowest figure was in Niobrara County. There, the average In-Migrant household earned $46,989, 7% that of Teton County.

Had Teton County not been part of Wyoming in 2010, the state’s mean In-Migrant AGI/household would have been 8% lower. In 2020 it would have been 38% lower.

Strikingly, in 2020 only two other counties exceeded Wyoming’s statewide mean In-Migrant AGI: Lincoln and Park. The former is a landing place for those priced out of Jackson Hole; the latter is Wyoming’s only other national park gateway county.

This suggests that more than just tax breaks is affecting where well-to-do In-Migrants settle in Wyoming. Given the counties which are attracting such folks, it appears the big differentiator is the qualities offered in the northwestern part of the state. There, in 2020, the four northwest Wyoming counties (Lincoln, Park, Sublette and Teton) accounted for 14% of Wyoming’s population, 20% of its acreage, and 30% of its AGI. They also are home to 56% of Wyoming’s US Forest Service land and 99% of its National Park Service land.

National Trends and Peer Communities

As the umbilical cord that connects where we live with where we work becomes increasingly stretched, frayed, and broken, people of means are finding it increasingly easy to live where they want to live, rather than where work requires them to live.

To that end, where are people of means moving?

In 2010, of the 25 counties with the highest In-Migrant mean household AGI, 17 were the location of either a major city or the suburbs of a major city. Only 4 were communities where lifestyle was the main draw.

In 2020, the situation was dramatically different. Only 7 of the Top 25 counties were the location of either a major city or suburb. In contrast, 7 of the Top 10, and 12 out of the Top 25, were lifestyle communities. (Table 2)

Between 2019-2020, 23% more people moved into the Top 25 high-income lifestyle communities than moved out. What’s really striking, though, is that the typical In-Migrant household made more than twice as much as the typical Out-Migrant household: $229,927 v. $95,486. Also notable: the mean Out-Migrant AGI of $95,486 was 10% higher than the mean US household figure. This strongly suggest that while lifestyle communities’ Out-Migrants are doing very well by national standards, they are getting crushed by lifestyle community standards.

As is true with so many income metrics, in 2020 Teton County had the most extreme gap between mean In-Migrant and Out-Migrant household income – the former was the nation-leading $661,001; the latter was $100,181, a 660% difference. In second place was Pitkin CO, where the difference was “only” 460%.

Also of note is that, among America’s 3,142 counties, Park County, WY ranked 19th in its gap between In-Migrant and Out-Migrant incomes (230%); Lincoln County, WY ranked 57th (180%), and Sheridan County, WY ranked 219th (146%). Even Teton County, ID (135%) ranked in the top 12% of all US counties – in 2020, the typical Teton Valley In-Migrant household made $114,916, while the typical Out-Migrant household made $85,249.

The conclusion? As the work-home umbilical cord becomes increasingly tenuous, people are flocking to places offering a high quality of life. For those who can afford it, lifestyle communities are all the rage. For the less well-to-do, lifestyle suburbs are becoming increasingly attractive. As all this plays out, though, those on the bottom end of the income scale are finding it increasingly difficult to stay in places which, a generation ago, were much more affordable.

Ominously, because those lower-income folks are often the workers undergirding the “lifestyle” in lifestyle communities, the traditional tourism business model – which depends on large numbers of relatively low-paid employees – likely faces a period of wrenching adjustment.

Observations

So what to make of all this?

Three meta-observations leap out:

  1. It’s not just Jackson Hole
  2. Going forward, current trends will accelerate
  3. Current approaches are no match for current patterns

It’s Not Just Jackson Hole

The fact that billionaires seem to be metaphorically pricing out millionaires in every desirable place is a modern-day variation of an age-old theme.

Humans have constantly searched for a better life. In America, 19th century settlers migrated west. In the 20th century, city-dwellers flocked to the suburbs. In the 21st century, our nation and planet are experiencing virtual suburbanization.

Whether physical or virtual, suburbanization has been made possible by improvements in technology and transportation, as well as changes in the economy and mores. In the 20th century, the ever-stretching umbilical cord between work and home was limited by physical constraints such as highways and telephone lines. As those extended their reach, so too did the suburbs.

In this century, technology has rendered moot most physical constraints – the rapid spread of reliable wi-fi is allowing increasing numbers of people to live where they want to live, regardless of their profession.

The people best-positioned to take advantage of this phenomenon are the well-to-do, whose sources of income are increasingly disconnected from where they live. As folks earning location-neutral income flock to places once considered off the beaten path, the newcomers’ wealth is making it increasingly challenging for long-term residents of formerly-remote places to continue to afford to live there.

This phenomenon is most easily seen in major resort communities. As Figure 7 shows, over the past ten years, the eight major Rocky Mountain ski counties – Teton WY (Jackson Hole), Blaine ID (Sun Valley), Summit UT (Park City), and Eagle, Pitkin, Routt, San Miguel, and Summit CO (Vail, Aspen, Steamboat, Telluride, and Breckenridge respectively) – saw virtually identical numbers of In- and Out-Migrants.

What’s striking, though, is that starting in 2018, the income earned by the typical In-Migrant household not only started growing faster than the typical Out-Migrant household, it also started growing faster than the typical Non-Migrant household.

That this phenomenon started a couple of years before COVID is significant, for it strengthens the argument that COVID merely accelerated extant trends.

If we widen our gaze to include seven additional lifestyle-oriented counties, the same basic patterns hold true. Figure 8 adds into Figure 7 the resort counties of Gunnison CO (Crested Butte), Gallatin MT (Big Sky), Monroe FL (Key West), San Juan WA (San Juan islands) and Barnstable, Dukes, and Nantucket MA (Cape Cod, Martha’s Vineyard, and Nantucket respectively).

The most striking thing of all, though, is that the same basic phenomenon is also occurring in the bedroom counties adjacent to major ski counties. Figure 9 looks at five counties where people priced out of major ski counties are moving: Garfield and Ouray, CO (proximate to Aspen and Telluride respectively), Wasatch UT (over the hill from Park City), and Teton ID and Lincoln WY (Jackson Hole’s neighbors).

While these lifestyle suburbs have much lower incomes, they share with their lifestyle community neighbors the fact that lower-income residents are being priced out. Combine this with the growing incomes of the lifestyle suburbs’ Out-Migrants, and it suggests growing numbers of people may be finding themselves priced out of not just lifestyle communities, but entire “lifestyle regions.”

Also striking is that in these lifestyle suburbs, the number of In-Migrants began consistently exceeding the number of Out-Migrants in 2016. This suggests lower-income residents of lifestyle communities began feeling serious economic pressures several years ago, catalyzing what has become a steady exodus to the surrounding lifestyle suburbs.

The ultimate consequence of this pricing-out phenomenon is what I call “special challenges;” i.e., the challenges facing all special places to live (and increasingly their physical suburbs). This suite of challenges is hallmarked by affordable housing, transportation, and growing income inequality, issues which haven’t been successfully addressed anywhere, even in big cities with a lot more money. For lifestyle communities – with their much higher incomes (and therefore much higher housing prices) and much smaller budgets – the challenges are even greater.

Going Forward, Current Trends Will Accelerate

As my venture capitalist friend noted, wealthy people go where they want to go. As they do, their actions create ripple effects in not just the communities they move to, but entire regions.

Decades ago, the quest for a better life led people without much money to geographically isolated places. In Jackson Hole, the original In-Migrants were ranchers; later came the wave of recreational enthusiasts. Similar patterns took place throughout the western US.

Bonding together previous generations of In-Migrants was a shared sense of sacrifice. By moving to a remote place, they enjoyed certain qualities of life available only in small towns in remote regions. But those qualities were not cost-free. Instead, they required In-Migrants to give up things ranging from proximity to friends and family to the employment, cultural, commercial, and educational opportunities available only in larger areas.

Today, moving to lifestyle communities such as those in Table 2’s Top 25 requires increasingly fewer sacrifices, particularly for the well-to-do. As a result, more and more people are making an increasingly easy choice – like generations before them, they’re heading to places offering a higher quality of life. As this “no trade-offs” pattern continues, so too will the income growth in lifestyle communities, with its concomitant effects on both those communities and their surrounding regions.

Current Approaches Are No Match for Current Trends

My analysis makes it clear where things are going – towards a future where Jackson Hole and, more broadly, all nice places to live are increasingly hallmarked by cultural homogeneity and economic stratification.

Knowing this, do we like where we’re heading? If we don’t, are we are willing to do the hard work necessary to create – or, more precisely, potentially create – an alternative future?

When running for re-election last fall, hundreds of people shared with me their concerns about where Jackson Hole is heading. Many harbored a much more personal concern – whether they will be able to remain in the community.

In times of stress, people look to government in general, and elected officials in particular, to do something. For me, this analysis is part of my response – before I feel comfortable taking action, I need to deeply understand the issue at hand.

Bigger picture, though, four years in office have made it clear to me that the forces sweeping over Jackson Hole, the Tetons region, and similar lifestyle areas are so powerful – the money is so large, and is moving with such velocity and strength – that local government can’t adequately address them.

Can local government slow things down a bit? Tweak things around the margins? Sure. But given all that’s affecting Jackson Hole, can it make a meaningful difference? No, not on its own.

Working in conjunction with other efforts, and asked to do things it can actually do, government has a vital role to play. But asking government to take the lead in producing a significantly different future is like asking a dog to climb a tree – however much it might want to, doing so is beyond its ability.

So what’s the alternative? Since November’s elections, that’s the question I’ve been asking myself. The vexing thing is that it’s uncharted territory – no place has successfully addressed its “special challenges.” Nor, with the exception of contemporary Jackson Hole, has any place in history developed a successful industrial or post-industrial economy without fundamentally compromising the health of its ecosystem.

So what do we do? For those who don’t like where things are going, how do we proceed into this uncharted territory? How do we figure out an alternative route without a map to guide us?

I don’t have the answers but over the past few months, a picture has started to emerge.

For starters, it involves gathering together and – critically – organizing the legion of folks who don’t like where things are going and want to create a different future.

To do that requires developing an alternative vision, one grounded not in platitudes but in clarity: clearly articulated values, clearly defined goals, and clear metrics for judging progress.

It also means broadening our perspectives. Dwight Eisenhower once noted “If a problem cannot be solved, enlarge it.” To me, at a minimum this means taking a regional approach to problems that transcend arbitrary political boundaries.

Finally, it also means taking a clear-eyed look at where things are, where we want them to be, and how we might get there. Then, of course, acting accordingly.

As I’m coming to see it, trying to bring all this about is emerging as the next chapter of my professional life. How to proceed isn’t clear, and how it will play out is beyond me. What I do know, though, is that I’ll need all the help I can get. Please let me know if you’d like to take part.

Filed Under: Uncategorized

Property Taxes, Anyone?

May 10, 2022 By //  by cothrivejs

Hello, and Happy May!

In an interesting metaphor for life in general, and the importance of optimism in particular, my daffodils are winning their battle with spring’s snows. They’re a little worse for the wear but beautiful nonetheless.

Speaking of spring, mine has been one of polar opposites. My late March and early April were pretty quiet, especially since I spent my spring break in COVID lockdown. I emerged healthy, but somehow doing laps between my bedroom, office, and kitchen didn’t recharge me like a full-blown vacation would have. As a result, I’ve felt rather buffeted by the onslaught of issues that has recently crashed down upon Jackson and its town council.

In no particular order, these issues include:

  • Notices informing property owners of a massive increase in the assessed valuation of the county’s property (the average 2021 to 2022 increase was 40%; my house went up 58%).
  • Some massive cost overruns on new government buildings (building prices have gone up about 1/3 since these projects were approved three years ago).
  • 18 different applications for government and non-profit capital projects seeking taxpayer funding. The collective cost of these projects is $400 million, and they’re looking for $275 million in tax revenues. Around $120 million will be available.
  • The town’s new fiscal year starts on July 1, so we are trying to create a budget that, ironically, will be very tight despite record-high revenues and savings (the tightness is a function of how much the local housing and labor markets have been upended by COVID migration and related phenomena).
  • A yet-to-be-finished sustainable tourism study which has both tourism’s champions and critics on edge.
  • A shifting regulatory regime which is raising questions about whether local government can continue the “parklets” program that has so benefitted local restaurants the past two years.
  • A real estate market increasingly disconnected from anything resembling local financial realities.

Oh, and by the way, we’re going into election season, with all its attendant silliness and angst.

Bottom line – life is rich.

I mention all this because, as I see it, it’s vital for elected officials to at least acknowledge how much angst is out there right now. To that end, in this newsletter I’d like to take a closer look at the aforementioned property valuation wallop.

With luck, in this newsletter I can shed a little light on the realities of the situation facing our community, as well as offer a suggestion to which I’d love your reactions.

  • A Bit of Background
  • Teton County’s Coal
  • Building Trends
  • Values Go Boom
  • A Mill Levy Primer
  • Setting Mill Levies
  • Property Taxes & Local Government Funding
  • Government’s Role
  • Lowering Property Taxes
  • 21st Century Community With a 20th Century Operating System
  • Cutting the Gordian Knot

Even by my standards, this is a long newsletter. Thanks for slogging through it, and I hope you find it of value.

As always, thank you for your interest and support.

Cheers!

Jonathan Schechter
Executive Director

A Bit of Background

In 2010, Teton County’s Assessor estimated the market value of all property in Teton County – land, buildings, capital equipment, and personal property – to be $12.5 billion. Five years later, it was about the same – due to the recession, the total property value was $13.1 billion, an average annual growth rate of only 1%.

As a point of comparison, during the same 2010-2015 period, Teton County’s total taxable sales grew 7% annually.

Leap ahead five years, and between 2015-2020, the assessor’s estimated market value of all Teton County property grew from $13.1 billion to $21.7 billion, an average annual growth rate of 11% – 11 times greater than during the first half of the decade.

Again as a point of comparison, during that same five year stretch, total taxable sales grew 4% annually, roughly half the 2010-2015 rate.

Then we come to the past two years.

According to the figures released by Teton County’s Assessor a few weeks ago, between 2020-2022 the total market value of all Teton County property grew from $21.7 billion to $34.4 billion, an annual growth rate of 26%. Total taxable sales are growing at essentially the same stratospheric rate, which yields a doubling time of three years.

To state the obvious, no system is well-equipped to deal with such rapid growth. As a result, Jackson Hole is feeling extraordinary strain.

Much of the growth in property values was due to rapidly-escalating real estate sales prices. Another and unknowable portion was due to the fact that, for many years (if not decades), Teton County had been out of compliance with a Wyoming law that requires county assessors to value property within 5% of its market value. Because Teton County’s assessments had generally been way below that target range, it fell to the previous and current Teton County Assessors – Andy Cavallaro and Melissa Shinkle respectively – to bring the estimates of Teton County’s property values to where they needed to be.

Combine this legally-required adjustment with a doubling of real estate prices over the past three years, and you get a community reeling from the recent massive increase in assessed property values.

Teton County’s Coal

For over a decade, residential land – undeveloped lots, developed lots, and the buildings upon them – has accounted for roughly seven-eighths of the total value of all Teton County property.

Residential land is to Jackson Hole what hydrocarbons are to the rest of Wyoming – the foundation of the community’s property values. Unlike hydrocarbons, however, as long as the community doesn’t fundamentally screw itself up, residential land can be “mined” over and over again.

In Wyoming, property taxes are the primary source of school funding. In Teton County, residential property has become so valuable that the local school district is one of only four statewide that take in more property tax revenue than Wyoming’s funding formula says they need (one of the other districts is in natural gas-rich Converse County; the other two are in natural gas-rich Sublette County).

Until around a decade ago, Teton County’s schools cost more to run than the community generated in property taxes. As a result, Teton County was taking in “excess” property tax revenues from Wyoming’s hydrocarbon-rich counties, especially Campbell County, America’s leading coal producer. Today, with “King Coal” on the decline, Campbell County is struggling, and its schools are getting money from Teton County.

Building Trends

In 2010, Teton County’s Assessor identified 11,513 residential lots. 77% were built upon, and 8% had guest houses, Accessory Residential Units, or similar structures.

In 2021, there were 11,644 residential lots, an increase of 131 (1% over the 11 years). 80% were built upon, and 11% had multiple structures.

In short, between 2010-2021 Teton County added 131 new residential lots. Because it built on 448 lots, though, the inventory of empty lots declined by 317 (11%).

Over the past decade, around 30% of the new builds included a second residential structure on the property. As a result, today around 50% more properties have a second residential unit on them than was true in 2010.

The data don’t make clear how – if at all – the additional structures are being used. As a result, some may be vacant guest homes, while others could be rental properties.

Values Go Boom

As noted above, the rise in Teton County’s assessed property values has been due to a combination of rapidly rising sales prices and the assessor bringing the county into compliance with state law.

Because the assessor’s values always trail market conditions, two points are notable.

First, even though the growth in property values was shockingly high, from a percentage perspective it made sense. This is because the big jump in values brought the percentage growth of Teton County’s assessed values into line with the percentage growth of local real estate prices – both have essentially tripled since 2010.

Second, because market prices are continuing to rise, and because market prices are still much higher than assessed values, further assessed valuation increases are likely.

A Mill Levy Primer

Why do we care about assessed valuation? Because it forms the basis of property taxes.

Getting from the former to the latter involves four steps:

  1. Determine a property’s market value.
  2. Multiply it by the state-mandated 9.5% to determine its assessed value. (E.g., the assessed value of a $1 million property is 9.5% of $1,000,000, or $95,000.)
  3. Divide the property’s assessed value by 1,000 to determine how much it will have to pay for each mill of property tax levied (in this case, $95,000/1,000 = $95)
  4. Multiply the value of the property’s mill by the number of mills being levied, and the result is the property tax.
    1. For example, in 2021, Teton County’s base mill levy was 56.979 mills. For our $1 million home, that mill levy will result in a property tax bill of $95 x 56.979 = $5,413.

Under Wyoming law, property taxes can fund six types of governmental activities:

  1. Public education
  2. County government
  3. Town government
  4. Hospitals
  5. Local conservation districts
  6. Local weed and pest districts

Also under Wyoming law, all of these save Weed & Pest districts are directly accountable to voters by dint of their boards being publicly elected (Weed & Pest board members are appointed by county commissions).

Of note is how consistent the number of mills levied on Teton County properties has stayed over the past decade-plus. The minimum was 56.479 mills in 2020; the maximum was 58.454 in 2014, 2016, and 2017 – a range of just 1.975 mills, or 4%.

Setting Mill Levies

Regardless of type or location, every Teton County property is charged the same basic mill levy. 2021’s basic levy was 56.979 mills.

On top of this, some properties lie in special districts which can charge additional levies for infrastructure and the like. Examples include the Alta Solid Waste District, the Teton Village Fire, Water and Sewer district, and roughly two dozen other infrastructure and water & sewer districts.

Local government has no control over 43 (75%) of the county’s basic 56.979 mill levy. These 43 mills are mandated by the State of Wyoming, and fund the state’s public education system. Changing these rates would require changing state law or Wyoming’s constitution.

The remaining mill levies are set at rates determined by local government. In 2021, 7.879 of the additional 13.979 mills (14% of the total mill levy) were levied by Teton County to fund its operations (including fire protection, the library, and the county fair), 3 mills (5%) by St. John’s Health, and 1.8 mills (3%) by the combination of Teton County Conservation District and Teton County Weed & Pest.

Beyond the state-mandated 43 mills for education, the Teton County School Board can levy a few additional mills for specific local educational needs. In 2021, they levied 1.3 mills for this purpose, 2% of the entire assessment.

Of particular note is how much property tax goes to fund schools.

Wyoming funds its schools based on a school enrollment-driven formula. In those districts where the 43 mills of mandated property tax generate less money than the formula says they need, the state gives them extra funding. In those districts where the 43 mills generate more, the state “recaptures” the extra funds and distributes them to those districts needing money.

Because Teton County’s property values increased so much between 2021 and 2022, in FY 2023 the state-mandated 43 mills will generate around $46 million more than the state feels Teton County needs to run its schools. As a result, $46 million in Teton County-generated property taxes will fund schools in other parts of Wyoming.

To put that figure in perspective, the $46 million in property tax revenue that will leave Teton County to fund schools elsewhere in Wyoming is about the same as the combined amount of property tax revenue that will be received by all local government entities able to set their own mill levy rates: St. John’s Health, the Teton County Commission, the Teton County Conservation District, the Teton County School Board, and Teton County Weed & Pest (whose rate is set by the county commission).

Property Taxes & Local Government Funding

Because Wyoming doesn’t have a state income tax, funding for state and local governments basically rests on a three-legged stool of property taxes, sales taxes, and taxes on mineral extraction.

Because Jackson Hole has no economically valuable minerals to speak of, most of the funding for Jackson Hole’s local governments comes from a combination of sales and property taxes. More precisely, most of the Town of Jackson’s funding comes from sales taxes, while a goodly chunk of Teton County’s funding comes from property taxes.

Two points are noteworthy here.

First, nearly 80% of Teton County’s property value lies in the unincorporated county. As a result, every mill of property tax the county levies yields roughly 5 times more than every mill levied by the town.

In addition, under Wyoming law counties can levy up to 12 mills, while towns are capped at 8 mills. As a result, if both governments maximized their respective mill levies, Teton County would raise around 7.5 times more property tax revenue than would the Town of Jackson.

In reality, the disparity is much greater. The reason for this is the second noteworthy point.

In the 1970s, the mayor of Jackson was Ralph Gill, one of the county’s largest landowners.Worried about the town’s finances, he struck a deal with town residents: If you vote to raise the sales tax, the town will no longer levy a property tax.

In those days, Jackson was a relatively poor town with a growing tourism economy. Recognizing that, Mayor Gill argued that swapping the town’s property tax for a sales tax made sense for two reasons: because a sales tax would generate a lot more revenue than a property tax, and because a goodly amount of that extra revenue would be paid by tourists (i.e., non-locals).

Agreeing with that logic, the town’s voters approved the sales tax, and for nearly 50 years the Town of Jackson did not levy a property tax. This changed in 2021, when the town council authorized a ½ mill tax on town property. In FY 2022, this will generate around $250,000, all of which will be earmarked for Fire/EMS services. It also puts town property owners on an even footing with county property owners, for due to an anomaly in Wyoming law, county taxpayers had been paying ½ mill more for Fire/EMS than had town taxpayers.

Government’s Role

Of the discretionary mills levied by Teton County’s various taxing authorities, the largest amount is levied by the Teton County Commission. If the commissioners levy the same 7.379 mills in FY 2023 that they did this year, they will raise around $25.7 million.

What does all that money buy? The simplest answer is that it funds the basic services of county government. These Core Services range from plowing roads to running the library; from providing public health services to running elections.

In addition, property tax revenue helps fund affordable housing efforts and local human services non-profits, organizations providing services the community needs but which are beyond the scope of local government.

All of this is good stuff. Yet for completely understandable reasons, at the moment residents are furious with their government.

Why? Well, for starters, having property values jump 40% in one year is nearly inconceivable, especially in a state that prides itself on low taxes. Plus, at the same time this explosion in assessed values hit, the town council and county commission voted to pay for a 50%+ cost overrun on the expansion of the Rec Center, the mind-boggling result of scope creep, bad estimating, and construction inflation.

(Self-serving interjection. I voted against paying for the Rec Center overrun, saying I would oppose it until we were able to do two things:

  • conduct a post-mortem on what went wrong; and
  • understand the Rec Center cost overrun in the context of both the town’s overall budget and several other current projects also facing cost overruns.

Unfortunately there seems to be a systemic problem with the way the community handles capital projects. This is causing me great concern in general, and tremendous concern given the $290 million of new capital project proposals that just landed on our desks.)

Throw all this into an environment overwhelmed by two years of COVID-driven angst – when so much has seemed so surreal and so many of us are feeling emotionally, physically, and spiritually ground down – and the result is a whole lot of frustration and anger.

Which we electeds are hearing about. It doesn’t matter that government has no control over many of the forces washing over the community. Nor does it matter that, in many cases, there is little we can do about those forces or their consequences.

What does matter is something much more primal and much more important: In times of crisis, people look to their institutions to fix things. In in the minds of at least a very vocal minority, Jackson Hole’s local governments are currently and manifestly not fulfilling that role.

Lowering Property Taxes

So given current circumstances, what should government do?

There are those demanding that property tax rates be lowered. If that happened, who would do it and what would it mean?

Given the fact that 75% of our property tax rate is set by the state, the only entity able to move the needle much on tax rates is the county commission. What if they were to, say, halve their mill levy?

Factually, it would cut the county’s projected FY 2023 revenues by $12.9 million, around one-sixth of their anticipated revenues. If that happened, the commissioners would face some difficult choices regarding which services to cut. Why? Because under Wyoming law, the county is legally required to provide a variety of Core Services. As a result, if major cuts needed to be made, they would likely come at the expense of non-Core expenditures such as support for affordable housing programs and the non-profits providing addressing human services needs. Efforts which, of course, are facing greater-than-ever demand for their services.

That’s one financial reality of a major property tax cut. The more significant one, however, is truly crazy, and rests on two realities.

Reality #1: Wyoming’s Constitution and laws mandate the levying of 43 mills of property tax.

Reality #2: Wyoming’s Constitution and laws mandate that assessed property values have to be within 5% of market value. Hence this year’s 40% increase in assessed values.

Combine the two, and even if every discretionary property tax were eliminated next year – even if the Teton County Commission, the Teton County School Board, St. John’s Health, and the Teton County Conservation District all agreed to levy zero mills of property tax – Teton County’s property taxes would still go up 6%.

Which raises a very interesting public policy question: How is the community best-served? By maximizing individual gain? Or by pursuing the collective good?

For example, let’s say that, in FY 2023, Teton County cuts its property tax levy by 50%. In such a case, the total tax bill facing Teton County’s property owner will fall by only 7%, raising the question: “How is the community best served: by 10,000 property owners each saving 7% on their tax bills, or by using the resulting $12.9 million to provide a variety of services that benefit the larger community, including some of its most vulnerable members?”

21st Century Community With a 20th Century Operating System

To answer questions like this, Jackson Hole needs to ask and answer a question it has never explicitly addressed: In our community, what is the proper role of government?

Historically, the answer has been shaped by Wyoming law, which ties government funding to a combination of property ownership and the very 20th century activities of going to the mercantile and digging stuff out of the ground. This mechanism produces a rather limited amount of revenue, resulting in local government being able to do little more than provide Core Services. Additionally, because of this focus on 20th century economic activities, Teton County’s governments can’t adapt to the more contemporary economic trends driving the community’s growth.

For example, in today’s Jackson Hole, untaxed real estate sales account for about 50% more gross revenue than taxable sales. Throw in the similarly untaxed professional services sector, and the figure goes up to about twice the level of taxable sales.

This disconnect between Wyoming’s 20th century operating system and Jackson Hole’s 21st century economy means there is little money available to address the challenges created by our very contemporary economy. Strikingly, these challenges include not only the obvious ones resulting from things like Teton County’s nation-leading income inequality, but also those facing property owners – Jackson Hole’s 21st century economy is causing property taxes to explode, creating real problems for those whose incomes aren’t growing as fast as property values (i.e., creating real problems for basically all of us).

Yet because Wyoming laws are so rooted in the mid-20th century, they don’t provide Jackson Hole the tools it needs – for example, a real estate transfer tax or the ability to offer property tax breaks for primary residences – to address its 21st century challenges.

Cutting the Gordian Knot

So what might we do?

Let’s start by acknowledging the obvious: Rapidly-rising property values have created a dilemma.

On the one hand, rising property values are fueling a concomitant rise in property tax revenues. These revenues are primarily benefiting Wyoming’s schools; to a lesser extent they are benefiting local government, health care, and conservation. Critically, those increased revenues are needed to offset the disruptions being caused by rising property values.

On the other hand, rising property taxes are creating a burden for those who aren’t extraordinarily wealthy. The well-to-do can afford to pay current Jackson Hole real estate prices and the concomitant property taxes. Those less well-off are struggling, particularly those long-time residents whose stewardship has made Jackson Hole such a desirable place to live.

Hence the paradox. How do we simultaneously help two struggling groups with diametrically opposite needs? One group needs greater amounts of tax dollars to address their needs, while the other needs their tax burden lowered. To make the challenge harder still, how do we accommodate both given the constraints of Wyoming’s 20th century operating system?

I can come up with one possible solution – imperfect, but not nothing: Link a reduction in property taxes to an increase in sales tax.

This isn’t an original idea. Instead, it’s just an updated version of what Ralph Gill championed 50 years ago. This time, the bargain would have two linked steps:
• In May 2023, ask voters to increase the local sales tax rate from the current 6% to the state-allowed maximum of 7%.
• If the vote is successful, the county commissioners would then cut in half the mill levy they control.

Doing this would have three positive results and one negative one.

Positive result #1: Local government– both Teton County and the Town of Jackson– would receive more revenue.

Positive result #2: The overall tax burden on Teton County residents wouldn’t change – locals would pay about the same total amount of tax, just with a different split.

Positive result #3: Because tourists account for about 50% of Teton County’s total taxable sales, essentially all of the extra money flowing to local government would come from tourists.

The negative result would be that while property owners would see their property tax burden decline, all residents – whether or not they own property – would pay more in sales taxes.

Under this plan, a back-of-the-envelope calculation suggests that the average property owner’s tax bill would go down around $1,000/year, and the average resident’s sales taxes would increase around $500/year.

So what will serve our community best? As I see it, there are three basic options.

Option 1 is to stay with the status quo –leave sales taxes and property tax rates where they are.

Under this option, property taxes will go up, and the county commission will have extra revenue for continuing to provide a mix of Core Services and support for things like housing and local social services non-profits.

Option 2 is that the county commission can lower the property tax rate, and in so doing keep property revenues flat or, perhaps more realistically, growing slower than they otherwise would.

With less money to work with and facing higher costs (due to both inflation and skyrocketing housing and labor costs), the county will have to tighten its belt, likely cutting back on things such as its support for housing and human services non-profits.

Option 3 is to swap a sales tax increase for a property tax decrease.

Under this option, local property owners will clearly benefit. But because that group includes both those of great means and those who are barely hanging on, by helping the latter we’ll also be using government policy to help the rich get richer (and they certainly don’t need any additional help…).

Making matters worse, those who don’t own property will find themselves paying more in taxes – and this at a time when inflation is already driving up prices.

Yet besides providing meaningful property tax relief to those who need it, this “sales tax for property tax swap” mechanism will also boost overall local government revenues between 10%-15%, allowing the county and town governments to provide greater services to the entire community, especially those in need of more assistance.

(Note: because of the town collects very little property tax, only option 3 will significantly affect the town’s finances.)

So what’s the right answer? I don’t know. Each option has merits, and I’m acutely aware of the many cross-currents involved in the issue, including the do-nothing option.

What I am certain of, though, is this. Raising the tax swap idea is a way of getting at the larger question of what role government should play in our community. That is a conversation worth having, and I look forward to hearing your thoughts.

Filed Under: Uncategorized

Gas Prices and Tourism, and More

March 13, 2022 By //  by cothrivejs

Hello, and happy almost-Spring!

Earlier this week, Jackson Hole awoke to its first significant snowfall in what seems like forever. To my eye, the beauty was greatly enhanced by the wait.

In a similar spirit, since it’s been a while since I’ve published a newsletter, I’m hoping the wait will make this edition seem even more interesting…

Today’s focus is on three seemingly disparate items, linked by a temporal quality – what may or may not happen over the next many months:

  • To Re-Run or Not to Re-Run
  • Wildfire and Homeowner’s Insurance
  • Gas Prices, Tourism, and Taxable Sales

Before diving in, one request. If you live in the Tetons region, will you please complete a survey exploring residents’ attitudes toward tourism? The deadline for completing the survey is Tuesday, April 5, 2022:


https://www.visitjacksonhole.com/locals


(Full disclosure: I heavily edited early drafts of the survey, and the final version reflects my contributions.)

As the days get longer, may your days become increasingly rich.

As always, thank you for your interest and support.

Cheers!

Jonathan Schechter
Executive Director

To Re-Run or Not to Re-Run

Budgets are the clearest indicator of an organization’s priorities. From that perspective, many years ago I found it curious that, despite having a Comp Plan whose Vision Statement so powerfully embraces ecosystem stewardship – “Preserve and protect the area’s ecosystem in order to ensure a healthy environment, community and economy for current and future generations” – neither the Town of Jackson nor Teton County were putting much money into pursuing their vision.

When I took office, this realization morphed into a goal for me to pursue; a polestar of sorts to guide my efforts whenever the job threatened to knock me off course. Happily, in the town’s FY 2022 budget my colleagues and I approved a unique-in-the-nation Ecosystem Stewardship Administrator job, and it will soon be filled.

I mention this because my town council seat is up in November, and I’m in the throes of deciding whether to run for re-election. On the positive side, there are many aspects of the job I really enjoy, and I think I’ve grown to become a pretty good local elected official. On the negative side, to be done properly the job requires far more time than the salary suggests, and its inherently chaotic nature can be exceptionally grinding, especially to a fundamentally introverted person like me.

Given this, at the moment I’m thinking my decision will be guided by answers to two fundamental questions.

First, can I find a new polestar? I lucked into championing the Ecosystem Stewardship position, and pursuing that goal served me very well these past few years. Now that the position exists, though, I need to find something else. Going forward, what might replace it?

Second, given my interests – including my vision for what Jackson Hole can be – how can I best pursue the things I want to do? Is the best use of my time being in elected office, or doing something else?

I mention all this because it in part explains why I’ve not published a newsletter in a couple of months. As part of my effort to answer my fundamental questions, I have been researching and writing a paper in which I try to understand the breadth and depth of the many challenges – and, critically, the many opportunities – facing the greater Jackson Hole region and, by extension, our nation and world.

What I originally envisioned as a modest exercise has now consumed a couple of months, and currently features a far-from-finished 60 page manuscript. Whether the paper ever sees the light of day isn’t clear to me. What is clear, though, is that if I do run again, playing an important role in that decision will have been the process of deeply considering where my community is, how its parts work together, and how we might be able to use our many environmental, social, and economic riches to make a meaningful difference in the world.

What do you think? I welcome any thoughts about whether I should run again (well, maybe not the snarky ones, but…).

Wildfire and Homeowner’s Insurance

At the end of December, a wildfire raced across Boulder County, Colorado. Nearly 1,100 homes were lost, and another 150 or so were partially burned. Total damages were estimated at over $500 million, an average of roughly $500,000 per home.

Making a bad situation even worse, many who lost their homes discovered their insurance wouldn’t cover the entire cost to rebuild. In many cases, their insurance didn’t even come close to making them whole.

That got me thinking – not just about my own personal situation, but about my community. Given the drought conditions throughout the west, and given that February marked a near-record low in local snowfall, my concern was that if a wildfire sweeps through Jackson Hole, many of my friends, neighbors, and constituents could find themselves in the same, awful boat as the folks in Boulder County; i.e., not only having lost their home, but finding out they were under-insured.

When I checked, I found out that I could have been one of those unlucky souls. In particular, my insurance company told me that under my policy, I would receive $225/square foot if I needed to rebuild my house. That struck me as low, but they assured me that this is what their computer model said were the costs for my area.

Curious, I talked to friends in the building trades. They said that, given supply shortages and Jackson Hole’s current building frenzy, the current actual cost of building a home like mine is more like $600/square foot.

Eventually I got things straightened out with my insurance company, but not before I found out that:

  • they were using one construction cost figure for all of Wyoming; and
  • their “one figure fits all” was based on building costs in Rock Springs, Wyoming, where the median home price is roughly one-tenth of that in Jackson Hole.

What about others in my community? Concerned, I wrote Wyoming’s Insurance Commissioner Jeff Rude, asking what steps his office could take to ensure that homeowners across the state knew whether they were adequately insured. I then followed up by meeting directly with Commissioner Rude and his team.

The upshot is that Wyoming’s Department of Insurance is looking into what it can do, both legally and in terms of getting information out to the state’s residents. Locally, I’ve shared the letter with the local media, in hopes they’ll find the story sufficiently interesting to write a story or two about the situation.

Finally, I’m using this newsletter to urge you to check your insurance. Please see whether you have the insurance level you want in case the type of nightmare that befell Boulder County should strike your neighborhood. Sadly, as our climate warms and the west becomes drier, that possibility becomes increasingly likely.

Gas Prices, Tourism, and Taxable Sales

All of Wyoming’s governmental agencies operate on a July 1 fiscal year. As a result, both the Town of Jackson and Teton County are in the early stages of crafting their respective budgets for Fiscal Year 2023.

Key to this effort is estimating how much revenue each body can expect to generate. And key to that is estimating the coming year’s taxable sales, because both the town and county are exceptionally dependent on sales taxes for their revenues.

In Jackson Hole, the county government’s annual general revenues are twice those of the town’s. But because sales taxes account for over half the bodies’ combined general revenue funding, local government’s financial well-being is closely linked to how much taxable stuff residents and tourists buy.

Over the past century, Jackson Hole’s economy has evolved from one emphasizing ranching to one emphasizing tourism to, today, one in which residents’ incomes increasingly come from location-neutral sources such as investments and professional services salaries.

Unfortunately, under Wyoming law these location-neutral economic activities generate no revenue for local government, and what’s not evolving is how local government is funded – as has been the case for over half a century, tourists still provide a significant chunk of those critical sales tax dollars.

But not as big a chunk. Since 2013, sales taxes generated by businesses associated with Teton County’s tourism-related industries have grown more slowly than those associated with industries not directly associated with tourism. In particular, the three taxable sales categories with the highest growth rates – on-line shopping, car sales, and the building and equipping of homes – are, at best, tangentially related to the region’s tourism economy.

For reasons ranging from individual livelihoods to community character, though, tourism remains vital to Jackson Hole. This raises the question of how the recent spike in gas prices might affect the critical summer tourism season (for all of Jackson Hole’s fame as a ski area, ~50% of each year’s taxable sales occur in the four summer months of June-September).

To explore this question, I looked at four data sets:

  • Annual average US gasoline price/gallon
  • Annual recreational visits to Grand Teton National Park
  • Annual recreational visits to Yellowstone National Park
  • Annual taxable sales for Teton County, Wyoming

For the first three, data were available from 1993-2021; for sales taxes, they were available starting in 1998.

The first graph below compares gas prices to national park visitation; the second compares gas prices to taxable sales.Whether you just look at the graphs or conduct a statistical analysis, the conclusion is the same: there is no statistically significant correlation between gas prices and local national park visitation or taxable sales.

(For data wonks, the R-squared value for gas prices and Grand Teton visitation is 0.05; for gas prices and Yellowstone visitation it’s 0.27; and for gas prices and taxable sales it’s 0.35. For non-data folks, R-squared is a measure of how closely two data sets are correlated. Values range from 0 to 1, and 0 means there’s no correlation at all, while 1 means there’s perfect correlation. As a point of reference, the closely-linked Yellowstone and Grand Teton visitation figures have an R-squared value of 0.86.)

A much stronger correlation exists between national park visitation and taxable sales. Stronger, but not perfect: the R-squared value between Yellowstone visits and Teton County taxable sales is 0.76; for Grand Teton it’s 0.79. This suggests that summer tourism is a decent, but far-from-perfect, indicator of what will happen with the community’s taxable sales. Gasoline prices are not.

Notably, as Jackson Hole’s economy has become increasingly driven by location-neutral income sources, the connection between national park visits and taxable sales has grown weaker.

What to make of all this? Two things catch my eye.

First, if you want to predict how many people will be visiting Jackson Hole this summer, ignore gas prices. However much intuitive sense the connection makes, there’s no factual evidence that gas prices affect local summer tourism – whether visitation numbers or taxable sales.

Second, despite the community’s ski culture, historically the four generally-overlooked shoulder months of April, May, October, and November generate nearly as much taxable sales as do the four heavily-hyped winter months of December-March. Here, too, it makes no intuitive sense, but 20+ years of data make a pretty compelling argument.

Filed Under: Uncategorized

Sky-High Incomes & Ecosystem Stewardship

January 5, 2022 By //  by cothrivejs

Hello, and the happiest of holidays to you!

This newsletter celebrates the unique, focusing on two items that are truly one of a kind.

Item one is that the Town of Jackson has finally posted the job description for its there-is-no-other-job-like-it Ecosystem Stewardship Administrator position.

Item two is that the IRS has put out data showing that, in 2019, Teton County, Wyoming’s mean per-return Adjusted Gross Income (AGI) was $312,442. This not only led the nation, but marked the first time in US history that a county’s mean per-return AGI exceeded $300,000.

To put Teton County’s figure in perspective, in 2019 New York County, New York (aka the island of Manhattan) had the nation’s second-highest mean per-return income. It was $212,534, a full $100,000 lower per return than Teton County’s.

Perhaps more striking still, 75% of Teton County’s income comes from investments and other, non-wage income (the US average is 31%). In 2019, Teton County’s mean per-return non-wage income alone was $235,186, 11% higher than New York’s total income figure.

These are insane numbers. Yet what’s really nuts is that these figures are from 2019; i.e., the year before COVID-19 migrants started flocking to Jackson Hole. As a result, 2020’s numbers should be much higher, and 2021’s numbers nuttier still.

Bottom line: If it feels like things are not just crazy, but spinning-out-of-control crazy, there’s a good reason for it.

Table of Contents

  • Ecosystem Stewardship Administrator
  • 2019 IRS Data
  • Basic data for Teton County, Wyoming
  • Teton County v. the rest of America
  • People moving out; people moving in
  • Charitable giving: actual and potential
  • America’s greatest income inequality
  • Observations

Not-at-all-crazy are two deeply-held feelings of mine.

First, I hope 2022 proves to be a year of great happiness and deep contentment for you and all those you love.

Second, thank you so very much for your interest in, and support of, my efforts. Words cannot capture how much that means to me.

The happiest of holidays, and here’s to a wonderful 2022.

Cheers!

Jonathan Schechter
Executive Director

Ecosystem Stewardship Administrator

The Town of Jackson has finally posted the job description for our new Ecosystem Stewardship Administrator position. Applications are due on Friday, January 24, 2022, at 12 noon.

Here are links to the general job posting, as well as the complete job description.

To my eye, the most important sentence in the general job posting is this: “Any combination of education and experience providing the required skill and knowledge is qualifying.”

The significance of this sentence stems from the fact that, to the best of my knowledge, no other local government in America has a position like Jackson’s Ecosystem Stewardship Administrator. This is because no other community in America has a Comp Plan whose vision is anything like ours: “Preserve and protect the area’s ecosystem in order to ensure a healthy environment, community, and economy for current and future generations”

Because of this dual uniqueness, there is no mold or archetype for this hire. As a result, the richer and more diverse our applicant pool, the greater the chances of the Town of Jackson finding just the right person to create and make a success of this entirely new position.

Please feel free to share this information as widely as possible — not just with folks who might be interested in the position, but with anyone who might know people who might be interested.

2019 IRS Data

Each year, the IRS presents an astonishing amount of data about each county’s tax returns. For example, did you know that, between 2010-2019, the number of Teton County households whose income tax returns were classified as “Farm Returns” rose from 143 to170 (1.0% and 1.1% respectively)? Or that, in 2019, Teton County residents’ total tax liability was nearly $1 billion – $969 million, over twice 2010’s figure of $440 million? Neither did I.

The IRS provides so much data that I can focus on only a fraction of it:

  1. Basic data for Teton County, Wyoming
  2. Teton County v. the rest of America
  3. People moving out; people moving in
  4. Charitable giving: actual and potential
  5. America’s greatest income inequality

Basic data for Teton County, Wyoming

In the 30 years between 1989 and 2019, the number of income tax returns filed by Teton County residents more-than-doubled, from 6,875 to 14,870. During that same time, residents’ mean per-return AGI grew over eight-fold, from $38,339 to $312,442. (Graph 1)

As noted above, the 2019 mean per-return income figure was a record high not only for Teton County, but for any county in any year in the nation’s history.

The 30 year average annual growth rates were:

  • Tax returns filed: 2.6%
  • Mean total AGI: 7.2%
  • Mean wage income: 4.8%
  • Mean non-wage income: 8.6%

As a point of comparison, over this same 30 year period the average annual growth rate for the S&P 500 was 7.8%; for inflation, it was 2.4%. (Graph 2)

Teton County v. the rest of America

Comparing Teton County to the rest of America, two 2019 figures are especially striking.

First, between 2018 and 2019, Teton County’s mean per-return AGI rose by $50,942 (19.5%). During that same time, America’s mean per-return AGI fell from $75,695 to $75,694, a drop of $1 (0.0%)

As a point of comparison, in 2019 40% of all US counties – a total of 1,263 – had a mean per-return income of under $50,942; i.e., their mean per-return income was smaller than Teton County’s 2018-2019 increase alone.

Second, in 2019, Teton County’s mean per-return income figure of $312,442 was over four times greater than the national average of $75,694. To put that figure in perspective, let’s quickly return to the aforementioned gap between nation-leading Jackson Hole and second-place New York City.

in 2019, Jackson Hole’s mean per-return AGI was essentially $100,000 greater than New York City’s; to be precise, $99,908. In contrast, a nearly-identical $99,732 gap separated second-place New York City and 63rd place Delaware County, Ohio, a wealthy suburban area bordering Columbus OH.

Same dollar difference. One place between us and New York. Sixty two places between New York and Delaware County.

Historically, the only county that has come even close to matching Teton County’s income has been New York, NY. New York led Teton County until 1994. Since then, Teton County’s per-return income has exceeded New York’s every year save two: 2009 and 2011. (Graph 3)

People moving out; people moving in

One of the many sources of angst washing over Jackson Hole is a sense that the community is being decimated by turnover, with new arrivals pricing out long-time residents. While IRS migration data shed some light on this, please note that we won’t know the extent of COVID-related migration until 2020’s data are released a year from now.

In its reporting, the IRS lumps all taxpayers into three migration-related categories:

  • Non-migrants; i.e., people who live in the same county two years in a row.
  • In-migrants; e.g., those who lived outside of Teton County in 2018, and in Teton County in 2019.
  • Out-migrants; e.g., those who lived in Teton County in 2018, and outside Teton County in 2019.

Migration data go back to 1990-1991, with income data provided from 1993 on. Broadly speaking, during those 28 years Teton County has experienced three migration phases, roughly coinciding with the past three decades.

Phase I was the 1990s. Call this the “population growth” phase. Each year, hundreds more households moved to Teton County than left, and the newcomers made about as much money as those already living here. Which was about twice as much as those leaving Teton County.

Phase II was the 2000s. Call this the “stasis” phase. Far fewer people moved here, and all three income figures – non-migrant, in-migrant, and out-migrant – were about the same at the end of the decade as they were at the beginning.

Phase III was the 2010s. Call this the “income growth” phase. This past decade was hallmarked by two qualities: volatility in migration patterns, and a huge explosion in income growth. It was also the first decade in which, for every year, the income earned by in-migrants was at least twice that of out-migrants.

In 2019, the mean per-return income for Teton County’s non-migrants was $169,719. For in-migrants, it was $265,413; for out-migrants it was $115,134. To put that latter figure in context, in 2019 only 49 US counties – 1.6% – had mean per-return incomes higher than that of the households leaving Teton County.

Combined, the migration-related data seem to support our migration-related angst, not to mention the quip about billionaires crowding out millionaires. (Graph 4)

Charitable giving: actual and potential

The IRS has made charitable contribution data available since 2010. Each year, Teton County has recorded the nation’s highest per-return charitable contribution figure. 2019’s $33,710 was the highest per-return contribution figure ever recorded, a full 72% higher than Teton County’s 2015 figure of $19,646 (the previous high).

Overall, in 2019 Teton County residents claimed 10.8% of their total AGI as charitable contribution. This, too, led the nation, the first time we’d done so. (Graph 5)

This extraordinary generosity raises two obvious questions.

First, how much of residents’ giving goes to local nonprofits?

Unfortunately, there is no direct way of answering that question. We can surmise, however, that because Teton County residents claimed a total of $501 million in charitable donations in 2019, most of residents’ giving is targeted at nonprofits outside the community (as total charitable contributions to local nonprofits are too small for a figure as large as $501 million to make sense).

Second, do residents have additional giving capacity?

At one level, it doesn’t seem possible, for as noted above, in 2019 Teton County led the nation in both mean donation amount and donations as a percentage of AGI.

That noted, it’s also true that between 2018 and 2019, residents more-than-doubled their total charitable giving. They also donated a much bigger percentage of their AGI than before.

Equally intriguing, until 2019 Teton County residents donated a smaller percentage of their AGI than did residents of some other counties.

More striking still, Teton County has never led the nation in percentage of non-wage income donated to charities, and has never come even close. In 2019, we were 9th in the nation in charitable donations as a percentage of non-wage income; before then, we barely averaged being in the top 1,000 of all counties.

Graph 6 compares Teton County residents’ charitable donation levels as a percentage of non-wage income to two benchmarks:

  • each year’s leading county; and
  • the state of Utah (which annually leads all states in its percentage of non-wage income donated to charity).

Bottom line? If Teton County’s already-generous charitable givers donated their investment income at the same levels as residents of the nation’s leading county and/or state, they’d have donated several hundred million more dollars annually than they actually did.

Combine this with the big leap in residents’ donations between 2018 and 2019, it seems likely that Teton County’s residents have greater charitable giving capacity than is currently being realized.

America’s greatest income inequality

As I first reported many years ago, historically Teton County has had the nation’s greatest income inequality. In 2019, this streak continued.

Since 2010, the IRS has broken every county’s tax returns into income brackets, with the highest bracket recording returns with AGIs of $200,000 or more.

In Teton County in 2019, 2,630 returns – 18% – had AGIs of $200,000 or more. These returns had a mean per-return income of $1,5 million, and accounted for 85% of the community’s collective income. The 82% of returns with AGIs of under $200,000 had a mean per-return income of $56,909, 1/26 that of those earning $200,000 and more. (Graph 7)

And again, these figures end in 2019; i.e., before Jackson Hole’s influx of COVID-19 migrants. As a result, these inequality figures have almost certainly grown in the past two years.

Observations

Sustainability involves three types of capital: environmental, economic, and social. As 2021 flows into 2022, Jackson Hole is unique in two of them: we sit at the center of the largest generally-intact ecosystem in the lower 48, and we have the highest mean per-return income of any county in American history.

Moving beyond 2022, however, it’s not clear whether we will retain both of these unique qualities.

Economically, there’s no doubt about Jackson Hole’s future. Given COVID-related migration, the worldwide explosion of remote working, and Wyoming’s tax-friendly legal structure, Teton County will clearly continue to enjoy record-setting wealth.

Much less certain, however, is whether we can maintain our environmental health.

We face what I’ve come to think of as the “Eco/Eco Dilemma.” The first “Eco” is Economic Development; the second is Ecosystem Health. The dilemma lies in the sad fact that, since the dawn of the Industrial Revolution 250 years ago, every place on Earth that has developed a successful industrial or post-industrial economy has, in the process, compromised the health of its ecosystem.

The one exception? Contemporary Jackson Hole and, more broadly, the Greater Yellowstone Ecosystem.

So what might happen?

On the one hand, Jackson Hole sits at the heart of the largest generally-intact ecosystem in the lower 48. Further, ecosystem stewardship is the foundation of our Comp Plan. Better still, we’re acting on that commitment – most recently through the creation of the town’s Ecosystem Stewardship position. This is truly great stuff.

On the other hand, there’s the Eco/Eco Dilemma.

In particular, recent growth patterns strongly suggest that the Tetons region – especially the counties absorbing Jackson Hole’s growth-related pressures – will succumb to the same pressures that have compromised ecosystems across the planet for the last 250 years. Indeed, despite Jackson Hole’s location at the headwaters of the Snake and Columbia river basins, two local streams are currently classified as “impaired” by Wyoming’s Department of Environmental Quality – not a good omen.

Making matters more complicated still, because no place on Earth has ever figured out how to solve the Eco/Eco Dilemma – i.e., ever figured out how to simultaneously develop a successful contemporary economy and maintain a healthy ecosystem – there is no blueprint for Jackson Hole to follow in its quest to “preserve and protect the area’s ecosystem.”

Without a blueprint, what will it take for us to solve the problem on our own? Two things:

  • A shared sense we’re in this together; and
  • A shared sense of the opportunity at hand.

We’re in this together

Throughout much of its history, living in Jackson Hole required making sacrifices. For some residents, this meant forsaking income and career opportunities. For others, it was being away from family and friends; for still others, not having access to cultural and consumer opportunities. Something about the place, however, made those sacrifices worth it, and that sense of shared sacrifice knit the community together.

Over the past 30 years or so, though, changes in technology, the economy, transportation, and mores have steadily eroded the need to make sacrifices. As a result, today it’s possible to live in Jackson Hole and truly “have it all” – an extraordinary lifestyle in an extraordinary setting without making any meaningful sacrifices.

Well, at least some of us can have it all. But when 18% of households are making 85% of the community’s income, not everyone is having it all. Far from it.

So if a sense of shared sacrifice can no longer knit us together, what can? In my view, our best opportunity is to collectively commit ourselves to solving the Eco/Eco Dilemma; to collectively commit ourselves to figuring out how we can continue to have both a thriving economy and a thriving ecosystem. For unless we can do that, we put at grave risk all that makes this region and community exceptional.

The opportunity at hand

Solving the Eco/Eco Dilemma may be an audacious goal, but our region’s history is replete with examples of people and organizations not just pursuing audacious goals, but achieving them. More striking still, these efforts have occurred in 50 year cycles, and we’re coming to the end of the most recent one.

In particular:

  • March 1, 2022 will mark the 150th anniversary of the founding of Yellowstone, the world’s first national park. In the 1870s, creating a national park was an audacious idea, if not a truly radical one. Yet today we see it as one of history’s great no-brainers.
  • In the 1920s, John D. Rockefeller Jr. began the process of buying 35,000 acres in the Jackson Hole valley, which eventually became part of Grand Teton National Park. Again, a truly radical idea. Again, an idea appropriate to the times. Again, an idea which has more-than-stood the test of time.
  • In the 1970s, the first conservation easements were placed on Jackson Hole properties. Viewed as radical at the time, the concept has become so broadly accepted that today more than 30,000 acres of land is protected in Teton County, Wyoming, and another 67,000 acres in the counties surrounding Teton County.

Our current decade marks 50 years after the last big initiative was launched, presenting today’s generation of Tetons residents with our opportunity to leave a meaningful legacy.

To leave a meaningful legacy will require us to be bold, but the same was true for our forbears 50, 100, and 150 years ago. As we proceed, though, our boldness needs to be tempered with humility, in particular a recognition that everyone who has chosen to live in the Tetons region has, whether consciously or not, also chosen to be a steward of this extraordinary place; a place which, as the National Park Service Organic Act puts it, is worthy of being conserved and left “…unimpaired for the enjoyment of future generations.”

Can we successfully address the Eco/Eco Dilemma? As was true for previous “50 year challenge” folks, the answer isn’t clear. Unfortunately, 250 years of precedent suggest the answer will be “no,” because after 250 years the Eco/Eco Dilemma remains unsolved. Making things more challenging still is the fact that seemingly every economic incentive is pushing us towards ecosystem-harming types of development; in particular towards providing increasingly expensive homes, services, and other products to the folks who can afford them.

Arguing for success, though, is Jackson Hole’s history of innovative conservation, and our deeply embedded passion for conservation.

This is an incredibly strong foundation upon which to build. Add in our extraordinary wealth and extraordinary philanthropy, as well as our potential for donating even more, and our generation has the raw materials in place for making a truly meaningful contribution to the region’s historic 50 year pattern.

To be clear-eyed about our opportunity, we won’t be able to figure out how to thrive economically and ecologically unless we consciously set out to do it. And even if we do, there’s no guarantee of success. But similar challenges were faced by those who founded Yellowstone, expanded Grand Teton, and set out to conserve Jackson Hole’s private lands. How incredibly great would it be for this generation to take its place among that pantheon?

As we move into 2022, here’s hoping we rise to the occasion.

Filed Under: Uncategorized

Elephants in the Room & Jackson Hole v. New York: The Co-Thrive Newsletter

September 22, 2021 By //  by cothrivejs

Hello, and happy September!

Wyoming’s governor was recently in town. After his speech, an acquaintance greeted me by saying: “What are YOU doing about hotels? What are YOU doing about traffic?”

I thought: “Why hello! So nice to see you too!”

The encounter stuck with me because, while at one level the comments were about Jackson Hole’s growth-related problems, they also reflected two additional qualities shared by so many people: a deep passion for our community; and the deep-seated angst hallmarking our times.

Regardless of where I go or with whom I speak, people are anxious about both our world and the seemingly intractable nature of the issues we face. Whether local or global, whether dog parks or COVID or climate change, we live in an era chockablock with great passion and great fears.

Reflecting on this, I began to wonder about the root causes of our manifold concerns. One hypothesis I thought worth exploring was how quickly Jackson Hole is changing, and whether that might be contributing to locals’ angst.

In particular, my focus was on how our community’s economy is evolving from location-dependent – i.e., dominated by tourism and informed by its values – to location-neutral; i.e., an economy hallmarked by income derived from investments, finance, and professional services. The result is the essay below.

Teaser

To lure you in, here’s the most interesting fact I uncovered in my research.

Out of America’s 3,143 counties, in 2019 Teton County ranked 4th in per capita jobs in the Finance & Insurance sector (the two are lumped together by the US Bureau of Economic Analysis, and 2019 is the most recent year for which data are available).

In first place was New York County, New York; i.e., the island of Manhattan. In 2019, the world’s financial capital had 0.28 Finance & Insurance jobs per resident, most of them in finance.

In second and third places were two midwest counties housing major insurance companies. Their 0.17 and 0.14 per capita Finance & Insurance jobs were mostly in insurance.

And then was Jackson Hole, with 0.13. What’s crazy about this is that there’s no obvious explanation for our extreme concentration of finance jobs. Yes we have a handful of insurance brokers. And yes we have several commercial banks and trust companies. But so, too, do hundreds of other places.

Yet somehow, per capita, we had more Finance & Insurance jobs than 3,139 other counties, including major financial centers such as Boston, Charlotte, San Francisco, and Minneapolis (5th, 12th, 13th, and 14th respectively).

And as an added bonus, between 2001-2019 Teton County ranked 13th nationally in our growth in Finance & Insurance jobs.

Why do we rank so high? My theory is that Teton County’s extraordinary wealth has become both a magnet and incubator for jobs in finance. And as finance grows in importance, that industry’s location-neutral ethos is increasingly clashing with our community’s historic location-centric character. Hence one major contributor to local angst.

One Final Note

At 5:00 pm MDT this Friday, September 17, the donation period closes for this year’s Old Bill’s Fun Run. Rather than send out a generic appeal, my hope is that this newsletter will convey the message “If you appreciate this kind of analysis, please donate to my Charture Institute through Old Bill’s.” PLEASE CLICK HERE TO DONATE.

The beauty of Old Bill’s is that donations are matched, historically at a rate of around 50%.

Remember, the deadline for donating match-eligible funds is Friday, September 17 at 5:00 pm MDT. PLEASE CLICK HERE TO DONATE

As always, thank you for your interest and support.

Cheers!

Jonathan Schechter
Executive Director

Elephants: In the Room and In the Grass

Let’s talk about elephants. The metaphorical ones. Not the pink ones associated with the DTs, but the ones that occupy living rooms. The ones which, according to the Swahili proverb, trample the grass around them when they fight.

Before we do, though, consider some background data.

Among America’s 3,143 counties, Teton County has the highest per capita income. It’s not even close: in 2019, our per capita income was $229,825, or 16% higher than second-place New York, NY’s. It was also over four times greater than America’s overall per capita income of $56,490. (Graph 1)

Graph 1

Teton County ranked first because we also led the nation in per capita investment income: $161,411 in 2019. In fact, our per capita investment income figure was so big that it alone would have ranked us second in the nation in per capita total income. (Graph 2)

Graph 2

Teton County has led the nation in per capita investment income every year since 1998. We have also led the nation in per capita total income every year since 2004, when a huge jump in the community’s investment income overcame New York City’s big advantage in wage income. (Graph 3)

Graph 3

Inevitably, all this investment income attracted finance-related businesses. As a result, between 2001 and 2019 Teton County’s fastest-growing employment sector was Finance. (Finance-specific employment data were not available until 2001 – Graph 4)

Graph 4

As a further result, in Teton County today more people are employed in Finance than in Construction, Government, Retail, Professional Services, and all other sectors except Real Estate and Lodging & Dining. (Graph 5)

Graph 5

Graph 6 helps explain why.

The math is stark: In Teton County in 2019, the average Finance job paid more than four average tourism-related jobs combined. It also paid more than 2.5 average construction jobs.

And while location-neutral Professional Services jobs don’t pay as well as those in Finance, they still pay gobs more than those in the “traditional” Jackson Hole job categories of Tourism, Construction, and Government.

Put another way, Jackson Hole’s location-neutral sources of income – investments, and jobs in Finance and Professional Services – are far, far, far more lucrative than our traditional location-dependent jobs in Tourism, Construction, and Government.

Also worth noting is that these data are from 2019, so don’t capture COVID’s effects. When the data for 2020 and beyond come out, they will show that COVID accelerated these trends, greatly increasing the disparity between Jackson Hole’s location-neutral economy and its traditional, location-dependent economy.

Graph 6

Two Critical Implications

From this perspective, consider two critical implications of the rise of Jackson Hole’s location-neutral economy.

Constraints

First, changes in the economy and advances in technology and transportation have made Jackson Hole’s geographic isolation less forbidding. This has led to increasing numbers of people moving to the region. As they have, Jackson Hole’s physical, political, and land ownership-related constraints have loomed ever-larger – simply put, there is increasingly less space in which to put everyone and everything that wants to be here.

In a constrained world, those with more resources tend to win. And in the constrained world that is Jackson Hole, the location-neutral economy has all sorts of resource advantages over the location-dependent one.

Why? The most important reason is that location-dependent and location-neutral industries have wildly different business models. As traditionally practiced, tourism – that supremely location-dependent industry – needs to employ a ton of people at low wages. Who, in turn, require abundant cheap housing. But when it takes four Tourism jobs to equal the pay of one Finance job, Tourism employees simply can’t compete. Nor can they compete with those making lots and lots of investment income.

The result? The kind of help wanted problems we’ve been experiencing. In turn, these are occurring because people with location-dependent jobs are being displaced by those with location-neutral incomes, who are buying up record amounts of housing at record high prices.

Billionaire gentrification

Second, like attracts like. Over time, more and more well-to-do people have been attracted to Jackson Hole because the well-to-do people who originally moved here started a process of what we might call “billionaire gentrification” – a few people of means coming here made it safer for the next wave, who in turn made it safer for the next wave, and so on.

The gentrifiers’ wealth inevitably attracted people working in finance, leading to Teton County’s aforementioned #13 ranking in Finance & Insurance job growth. (Our 5.7% annual growth rate in Finance & Insurance jobs was over six times faster than that of 1,412th-place New York’s rate.)

We also saw significant growth in Professional Services jobs, further accelerating the shift away from our traditional location-dependent economy toward our new, increasingly location-neutral one.

COVID Hasn’t Helped

COVID has only accelerated Jackson Hole’s billionaire gentrification process, which in turn has put additional strains on our tourism businesses – be it in finding employees, housing employees, or maintaining their financial growth targets.

To address these challenges, many of our location-dependent businesses and industries – including the Jackson Hole Mountain Resort, St. John’s Health, restaurant groups, hotel groups, and construction firms – are vertically integrating or otherwise consolidating. Another tactic COVID has forced upon many businesses is to see just how lean their operations can become.

Such strategies can only be pushed so far, though. As a result, local location-dependent businesses are going to increasingly struggle as their traditional approaches to growth and profitability face myriad challenges and constraints, including:

  • competition with location-neutral businesses (hello Chase and First Republic banks);
  • competition with growth-oriented national chains (hello Black Diamond, REI, Target, and Whole Foods);;
  • community backlash against more visitors (especially as our location-neutral economy grows, and residents become less dependent on tourism for their livelihoods); and
  • the viability of the ecosystem on whose health tourism depends.

Back to the Elephants

Which brings us back to elephants.

In this metaphor, there are two elephants in the room: Jackson Hole’s location-dependent economy and its location-neutral economy. We know they’re there, and of course tourism gets a lot of attention. Receiving less attention, however, is our location-neutral economy; receiving even less is how the two are increasingly competing for the same limited resources of people, housing, and land.

Which, in turn, leads to the Swahili proverb: “When elephants fight, it is the grass that suffers.”

While businesses in both the location-dependent and location-neutral economies share a focus on profitably and Return on Investment (ROI), their very different business models are increasingly incompatible. This is especially true when it comes to how Jackson Hole uses its land, whether for housing, bricks-and-mortar businesses, or hosting visitors. As a rule of thumb, location-dependent businesses need to have more employees on site, and more people coming here as customers. In contrast, location-neutral businesses’ employees and customers can be anywhere. Throw in much greater profit margins for location-neutral businesses, and you have the recipe for a resource-driven clash which increasingly favors location-neutral industries.

As that battle escalates, things will become increasingly difficult for our location-dependent industries, which in turn will make it harder for all of us – particularly those who came to Jackson Hole for reasons other than maximizing ROI – to maintain a shared sense of community and comity.

Put another way, by definition location-neutral industries are agnostic towards their communities, while the fate of location-dependent industries is deeply entwined with that of their locales. As these differences play out, one result can be trampled grass.

Extending the metaphor, in our local version of two elephants fighting, the grass is both the region’s ecosystem and its residents of modest means.

Regarding the former, how will our already-under-pressure ecosystem respond to our rapid growth in visitation? This summer, Yellowstone, Grand Teton, and the Jackson Hole Airport all set new activity records, and the trend shows no signs of abating. Why? Among other reasons, shrinking revenues from other sources is driving airlines, tour operators, and state and local governments to ramp up their marketing of our region, leaving it up to us to figure out how to deal with the growing number of visitors. This may help the tourism industry, but at what cost to the community at large?

Regarding the latter, right now it seems that the only folks who can afford to buy in Jackson Hole – and increasingly in our region – are people with location-neutral incomes. If this continues, things do not bode well – not just for our location-dependent industries, but for those people who don’t make a ton of money yet form the warp and woof our community and its character.

These clashes between location-neutral and location-dependent industries are already occurring, and will only get worse as the two elephants compete for the region’s increasingly constrained resources. And not just locally. Nationally and globally, this same location-dependent v. location-neutral clash is occurring, producing similar dynamics and similar stresses for both the elephants and the “grass people” affected by the battles.

Looking to the future, are we “grass people” and our “grass communities” destined to be little more than collateral damage, the victims of a titanic struggle for economic dominance? Possibly. But because we can see it coming, we can also try to set up guardrails to protect the things we value from forces that can too often be indifferent to the locations in which they operate.

That is our challenge. It’s also our opportunity. Game on.

Thank You for Your Support

Please support CoThrive, 22 in 21, and Charture’s many other efforts by making a donation through Old Bill’s Fun Run?

Click here to go to the Charture-specific donation page.

Filed Under: Uncategorized

  • « Go to Previous Page
  • Page 1
  • Page 2
  • Page 3
  • Page 4
  • Go to Next Page »

Primary Sidebar

Recent Posts

  • Unaffordable Housing
  • It Ain’t Me, Babe
  • A Bit More Local Politics
  • The Fundamental Question Facing Every Voter
  • CoThrive : Managing Traffic Expectations