Hello, and happy Mother’s Day!
It’s mid-May, that magical time of year in the northern Rockies when, as the days become longer, you can practically see plants growing in real time. Especially after our exceptionally long and gray winter, the lushness is profoundly welcome.
Sadly, my outdoors time is constrained by the fact that it’s also government budget season. Wyoming’s governments operate on a July 1 fiscal year, so we in local government are deep into shaping our FY24 budget. The effort is particularly grinding this year, as we find ourselves between the rock of slowing revenue growth and the hard place of growing community desires.
Hence the focus of this newsletter: Trying to use a handful of basic local economic indicators to make some sense of Jackson Hole’s economic situation – past, current, and future.
Caveat emptor. For as much as I’ve tried to keep this essay simple, the section labeled “Data Geekdom” is just that. While I think it’s interesting, it’s been pointed out to me that my tastes are not always universally shared. Weird…
As always, deepest thanks for your interest and support.
Cheers!

Jonathan Schechter
Executive Director

The Great Disconnect
Among the local tourism community, there’s great concern that the summer of 2023 will be “soft.”
Driving this concern is the fact that advance bookings for July and August – the clearest predictor of visitors during Jackson Hole’s most important tourism season – are down double-digits from last year. They’re so far down, in fact, that some folks are speculating summer 2023 will the quietest in years, akin to the pre-COVID period of 2018 and 2019. During those years, taxable sales were 30% or more below current levels. (Figure 1)

Which raises an interesting question. How do we judge “soft”? More broadly, how do we determine “success”?
With both visitation and sales taxes, our default definition seems to be “growth = success.” In the case of the former, success equates to having more visitors. With the latter, it’s more taxable sales.
There’s also an assumption the two are linked: If we have more visitors, presumably we’ll have more sales. Fewer visitors, fewer sales.
Yet recent data suggest things might not be so simple, instead hinting at what we might call the Great Disconnect. In particular, between the summers of 2021-2022, even though visitation was sharply down, taxable sales were up: Yellowstone visitation was down 40%, Grand Teton visitation was down 26%, and Jackson Hole Airport enplanements were down 34%, yet taxable sales rose 1.1%.
How can that be? And regardless of the answer, were we successful? Or not successful? Or…
Finally, how do we judge success in light of what I heard from many people – including prominent tourism leaders – that they were secretly thrilled with how last summer played out. “I didn’t hit budget, but without all the tourists it felt like we had our valley back again,” one told me. “I’ll take that any day.”
Jackson Hole’s visitor numbers cratered last summer for two reasons: the Jackson Hole Airport was closed for around 90 days as it replaced its only runway; and parts of Yellowstone were closed for long stretches because flooding damaged its roads. Grand Teton National Park’s visitation suffered collateral damage from both.
Yet as I note above, taxable sales were up. The more I thought about it, the more I started wondering: “If sales taxes are driven by tourism, why didn’t 2022’s sales tax numbers plummet along with visitation?” Here’s what I discovered.
Visitors and Sales Taxes
How have we come by our definitions of success regarding taxable sales and tourism levels? Arguably by taking the path of least resistance.
On a monthly basis, the State of Wyoming measures sales taxes. Why? Because they are one of the state’s few sources of revenue. Sales taxes are especially important to local government, where they form the core of local government funding: Sales taxes account for around 45% of Teton County’s general fund revenue, and 75%-80% of the Town of Jackson’s.
So we measure sales taxes. Frequently, and at a granular level: The state’s monthly reports are county-specific, and they list the sales taxes collected in each county in each of 308 different business categories.
Similarly, because visitation statistics are critical to national park management, every month both Grand Teton and Yellowstone report visitor counts. Similarly again, because enplanement counts are critical to airport service, every month the Jackson Hole Airport reports commercial airline enplanements.
Thus we arrive at the four measurements that form the basis of how we evaluate success: sales taxes, Grand Teton and Yellowstone visits, and Jackson Hole Airport enplanements. Are these metrics are the best way of evaluating the community’s economic success? That’s debatable. Are they the easiest way of evaluating the community’s economic success? That’s indisputable.
Wyoming has been reporting sales taxes at the aforementioned level of granularity for over a decade, so the next few figures look at these metrics for the period starting in 2012.
For the years 2012-2022, Figure 2 shows the annual counts for our three major visitation statistics, as well as their compounded annual growth rates. Of the three, only the Jackson Hole Airport’s activity was growing before COVID hit. (Note: the fuchsia lines show growth from 2012-2022.)

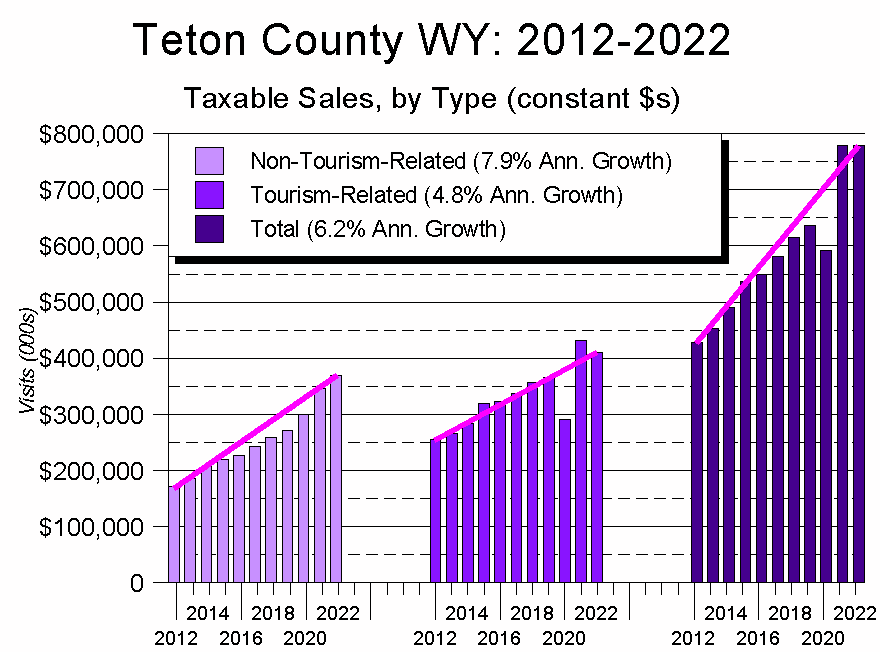
Figure 3 shows taxable sales during the same period.
Before analyzing the graph, two methodological points.
First, many of the following graphs show constant dollars; i.e., each year’s dollar figures are corrected for inflation.
Second, to try to get a better handle on this “What’s causing the Great Disconnect?” question, I combined the 308 business categories into two macro-groupings: Tourism-Related and Non-Tourism-Related. The former includes all Lodging, Restaurants, Rental Cars, Tourism-related Retail such as clothing, sporting goods, and gift stores, as well as a hodge-podge of other tourism-oriented categories. The latter includes everything else. And while I’m acutely aware it’s an imperfect system (e.g., locals go to restaurants, buy sporting goods, and the like), at a minimum if offers a consistent approach for analyzing the data over time.
Using this construct, Figure 3 offers two important insights:
- Since 2012, Non-Tourism-Related sales have grown faster than Tourism-Related sales.
- While Tourism-Related sales dropped 20% during COVID, Non-Tourism-Related sales rose 11%. As a result, for the first time in history, in 2020 Non-Tourism taxable sales eclipsed those related to tourism.
Add it all together, and we get a sense of why our taxable sales economy weathered the COVID downturn far better than anyone anticipated: Locals picked up the slack.
Probing Deeper
But how exactly did locals pick up that slack? Digging a little deeper, a clearer picture emerges.
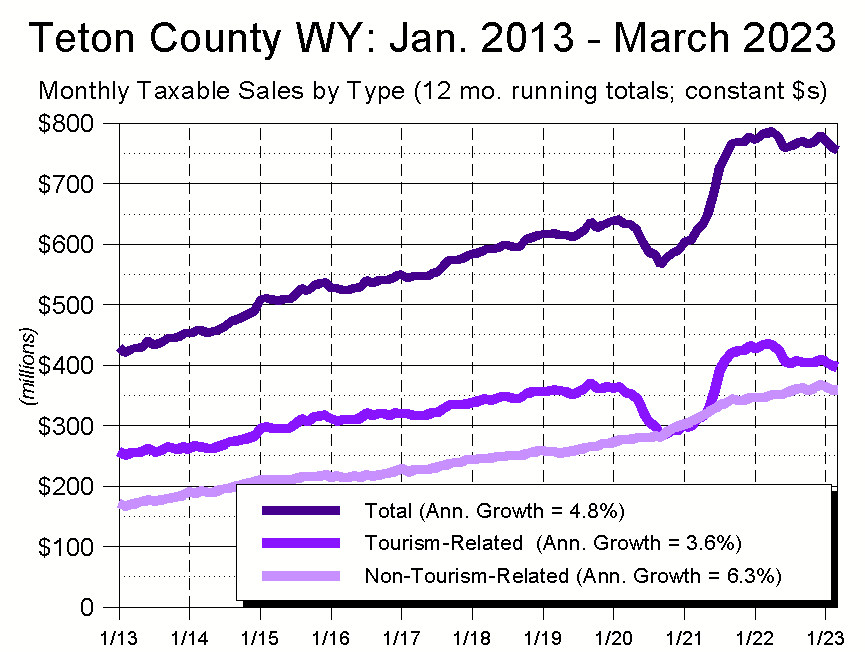
Figure 4 shows the same data as Figure 3, but on a monthly rather than annual basis. The figures show 12 month running totals, and again I’ve corrected for inflation.
By presenting monthly data I can also extend the analysis to March 2023. This is important because as Figure 4 makes clear, for the past six months or so Jackson Hole’s taxable economy has been stagnant (particularly when inflation is taken into account).
What’s striking about this is that the past six months includes our just-completed epic winter. Yet despite record snowfall, Jackson Hole’s taxable economy was flat.
Why? How can we – ostensibly a “ski town” – enjoy the best snow in decades yet not see any gain in taxable sales? Was everything in the doldrums, or just some sectors?
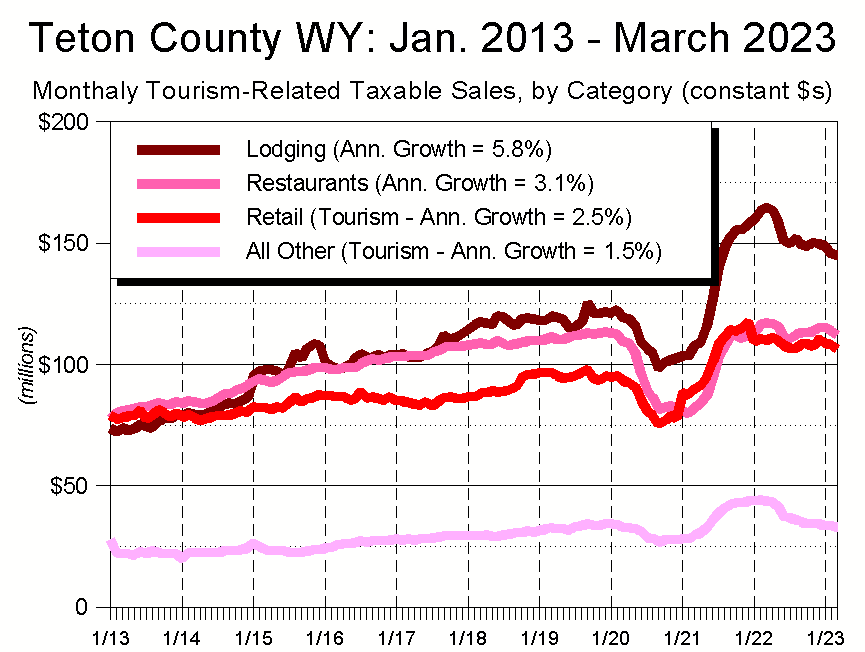
To answer that question, Figure 5 looks at the four components of my Tourism-Related macro-grouping. From a revenue perspective, local lodging hit its peak at the end of the 2021-22 ski season, and has been in decline since.
This seems to be a function of two things. First, while last year’s snowpack paled in comparison to this year’s, what matters is not the absolute amount of snow we get, but how much we get relative to other ski areas. Our snow last year may not have been epic, but innkeepers apparently took advantage of the fact that it was a whale of a lot better than anywhere else in the western US.
Second, last summer the decline in the number of tourists resulted in less demand for hotel rooms and/or lower prices.
Restaurants and Retail weathered the decline in tourism numbers better than Lodging, which may be due to the fact that, while locals rarely rent hotel rooms, they frequently eat out, buy sporting goods, and the like. Using similar logic, many of the industries in “All Other (Tourism)” tend to focus on tourist-oriented activities (e.g., car rentals, scenic tours, and the like).
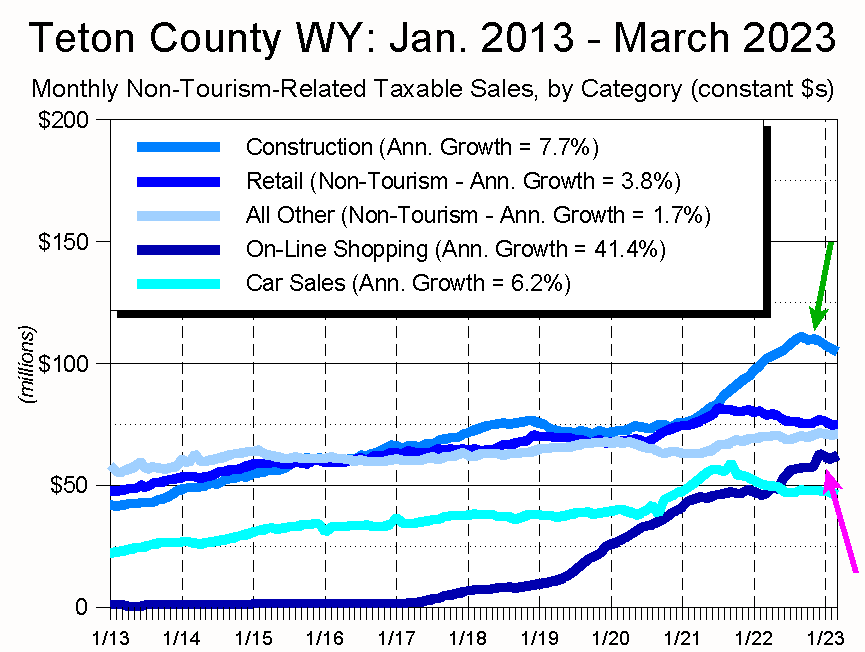
Two things jump off of Figure 6, which shows the Non-Tourism-Related categories of local taxable sales.
First, Construction.
At the beginning of 2013, Construction-related taxable sales (the green arrow) totaled less than Non-Tourism Retail and All Other taxable sales. Today, Construction sales are over 40% higher than both.
But the real story is Teton County’s boom industry: On-Line Shopping (the fuchsia arrow).
In 2017, Wyoming started demanding that on-line merchants charge sales tax. Five years later, we’ve reached a point where, today, on-line purchases by Teton County residents generate about as much in sales taxes as do their purchases from local stores catering to locals’ needs.
During COVID, On-Line sales nearly doubled. Those sales, along with a spike in Car Sales, saved our taxable sales economy from the worst economic consequences of the pandemic.
Looking Ahead
The striking thing about both Figures 5 and 6 is that, since last autumn, none of the nine sales categories has grown. Most have fallen, and even On-Line Shopping, that most reliable generator of local sales tax growth, has been stagnant for the last several months.
So what might the future hold?
To repeat a point from above, there is a concern among local tourism mavens that this coming summer looks soft. But if last year showed we can enjoy modest sales tax growth even in the midst of cratering tourism number, how big a concern is that?
Unfortunately, I fear it’s a non-trivial concern. I say this because each time tourism revenues have turned down over the past decade, that slump has occurred at a time when Construction, On-Line Shopping, or both have been growing. Today, though, taxable sales related to Construction are declining, and On-Line Shopping is stagnant.
This matters because, to repeat another point made earlier, local government in general, and the Town of Jackson in particular, is highly dependent on sales tax revenues. When combined with the money received from various federal stimulus programs, the past few years’ surprisingly high sales tax figures have allowed local government to address a lot of wants and needs. As the stimulus funds dry up, though, a simultaneous slowing of sales tax revenues will make for some difficult funding discussions.
Data Geekdom
One other note.
Several years ago, I noticed that the graph line of local taxable sales looks a lot like the graph line of the S&P 500 Index (Figure 8).
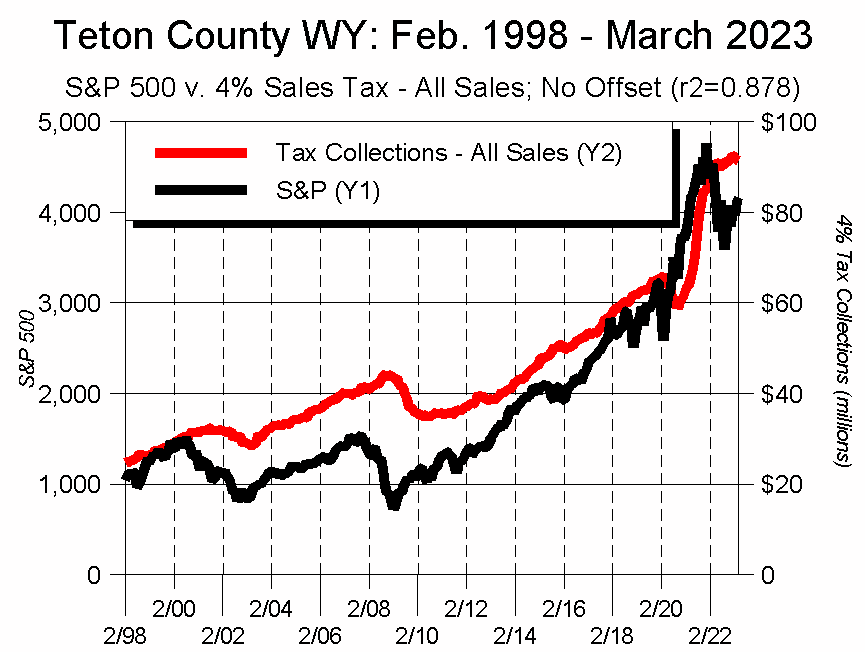
When I dove into it, I discovered not only that they look alike, but that the S&P 500 can be used to estimate future taxable sales.
A basic tenet of statistics is that correlation is NOT causation, and I’m NOT saying changes in the S&P 500 cause changes in local taxable sales.
What is striking, however, is that there’s a clear correlation between the two, one that can help us see where local taxable sales might be heading.
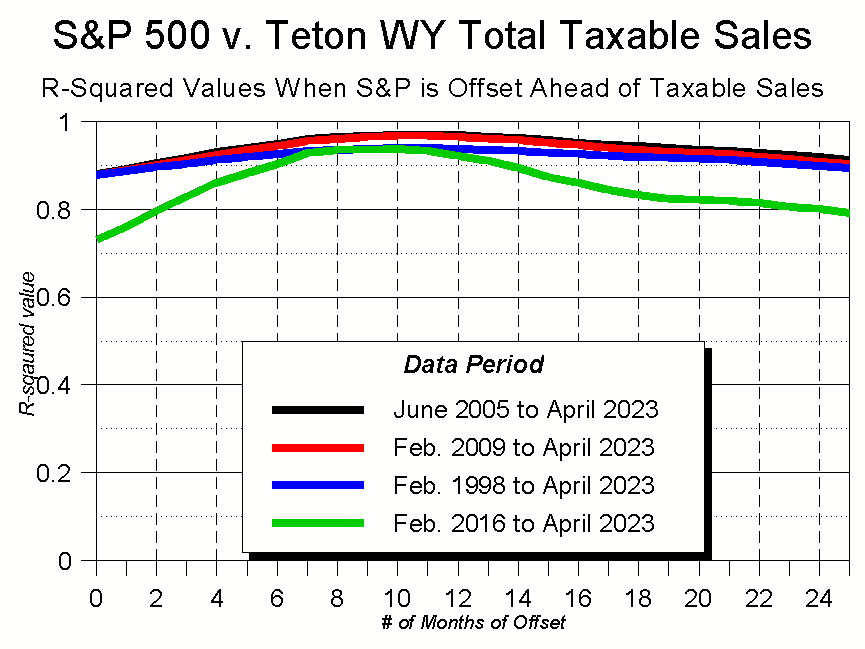
The foundation of my statement is a metric called “R squared,” which quantifies the correlation between two data sets.
R squared values fall between 0 and 1, and 0 means the two data sets have no relationship to each other (e.g., there is no relationship between someone’s shoe size and the number of jellybeans in a jar).
In contrast, an R squared value of 1.0 means the two data sets have a perfectly correlated relationship.
An R squared of 0.7 is considered strong. An R squared of 0.9 and higher is extraordinarily strong, and that leads us to Figure 8.
Figure 8 looks at the relationship between the S&P and local taxable sales over four different time frames, each rooted in a date when we saw a significant shift in local taxable sales patterns.
Along the X axis, I compare today’s taxable sales figures to the S&P 500 values ranging anywhere between 0 and 25 months ago. The Y axis shows the corresponding R squared value.
What I found was that, particularly for the longer-term time frames, there is a remarkably close relationship between where the S&P 500 Index was a while ago, and where Teton County’s taxable sales are today. Even in the “worst case,” the R squared values are above 0.7.
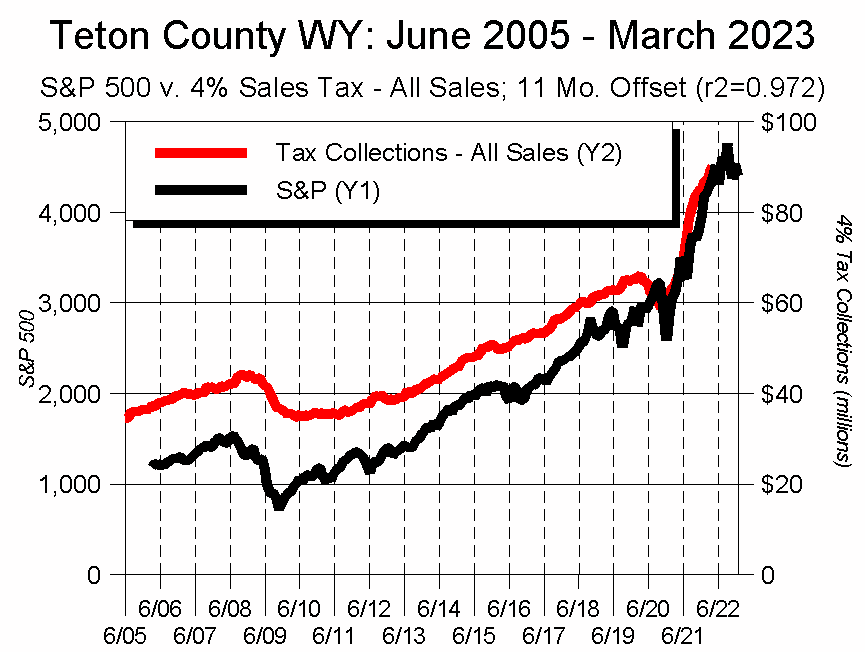
The single strongest r-squared value I found was one of 0.972 – an essentially perfect correlation – when I used the June, 2005 dataset, and offset the S&P by 11 months. What this tells me is that it’s highly probable that, one year from now, our taxable sales will be at about the same level as they are today. (Figure 9)
Conclusion
The tight correlation between the S&P 500 and local taxable sales stands in sharp contrast to what seems to be the increasingly loose relationship between Jackson Hole’s visitation numbers and our taxable sales.
So what’s going on?
It’s not entirely clear, but as Figure 10 suggests, particularly over the past several years, a second, complementary engine seems to have emerged to power Jackson Hole’s taxable sales growth: growth itself. Growth in construction spending. Growth in consumer goods. Growth seemingly commensurate with the amount of wealth pouring into the community. In fact, growth in consumption that’s even greater than residents’ income growth.
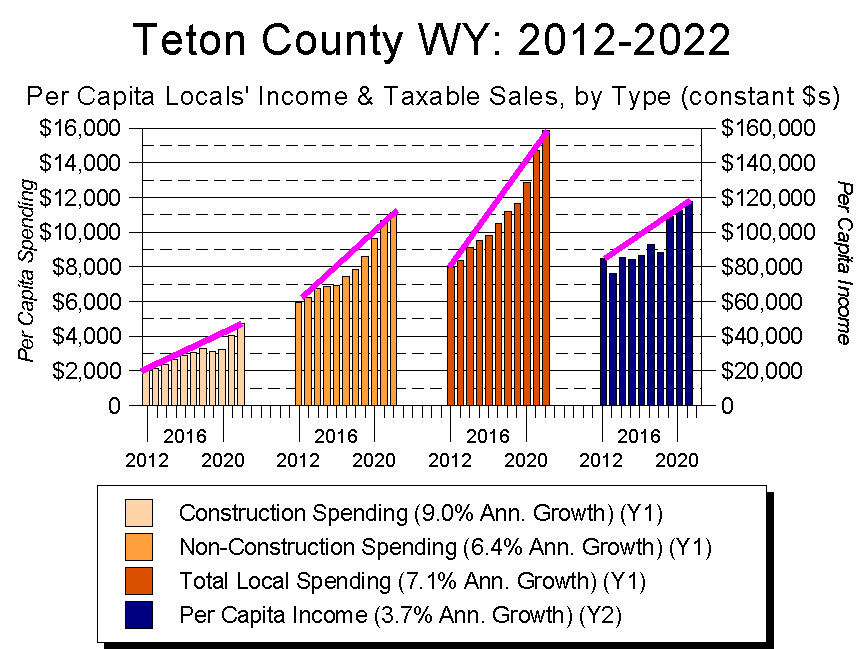
Some of this has to do with construction, of course, which is such a hugely expensive proposition. But when locals’ per capita Non-Construction spending is also growing faster than income, it suggests Jackson Hole may be embracing an ethic of consumption for consumption’s sake. If true, that strikes me as something new to this community.
Whither tourism?
Is tourism still important to Jackson Hole? Absolutely. And at a lot of levels. For example, from a selfish perspective, every dollar of sales tax I pay to fund our government is being matched by a dollar paid by a tourist.
But a decade ago, it was more like every $4 of sales tax I paid was being matched by $6 paid by tourists. That’s an interesting, and non-trivial, shift.
For a while now, tourism has been evolving as an industry. And as with so many other aspects of our life, COVID poured gasoline on the pace and magnitude of that evolution.
Locally, part of the evolution is linked to the growing number of well-to-do people moving to Jackson Hole. Few of these newcomers have direct financial connections to tourism, leaving them less invested in its success.
Looking ahead, another critical part of the evolution will be driven by the fact that, increasingly, Jackson Hole is pricing out our traditional summer tourist.
Echoing what’s happened with Jackson Hole’s housing market, as lodging rates go up, lower-end consumers are priced out. In that environment, businesses that can evolve to serve a higher-end clientele will do so, charging ever-higher prices for to an ever-smaller group of customers.
But what of those businesses which depend on the mass market? Whose success lies in selling a large quantity of goods at a lower price to lower-end customers? Those business have traditionally served national park visitors, complementing the Park Service’s mission to serve every American. Yet what happens to Grand Teton’s visitation when large numbers of people can’t afford to stay in Jackson Hole? And what happens to Jackson Hole’s tourism economy? These, and related questions, are yet to be answered.
Over the past few decades, Jackson Hole has built up a remarkably sophisticated tourism industry, investing hundreds of millions into a tourism ecosystem that has managed to strike a successful balance between the needs of commerce, the needs of the community, and the needs of our environment.
The economic realities underlying that balance are shifting rapidly, though, creating arguably unprecedented uncertainties for the industry and community alike. To loop back to the beginning of this essay, it seems likely we will no longer be able to determine “success” by simply growing our visitor count and increasing sales tax revenues. Instead, the clearer we can be in creating a holistic definition of success – one encompassing not just a handful of basic economic measures, but also metrics focused on our community and environment – the more successful our future will be.
