Hello, and happy August!
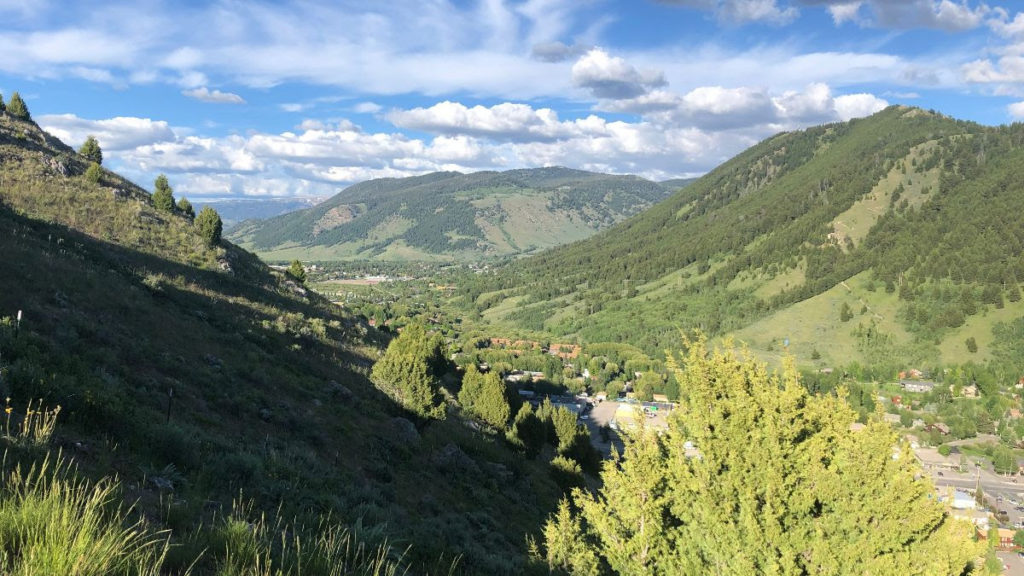
In many ways, Jackson Hole is special but not unique.
This reality was driven home to me anew recently, as I compressed two years of untaken vacation into about eight weeks. My trips took me as far south as Flagstaff, Arizona, and as far north as Denali National Park.
Whether as big as San Francisco or as small as Talkeetna, Alaska, every place I visited was experiencing labor shortages, resulting in stores and restaurants shortening their hours and/or closing some days.
Most places I visited were also experiencing record levels of visitation. Certainly this is Jackson Hole’s reality, and the resulting pressures are the focus of the essay below.
- PS: I Need Your Help, Please
- Who is Benefiting from Our Current Boom?
- What’s Good For GM…
- Thank You for Your Support
Two other thoughts frame this newsletter.
First, what’s going on in Jackson Hole (and Moab and Flagstaff and Lake Tahoe and Idaho’s panhandle and…) isn’t new, but instead an acceleration of phenomena occurring before COVID-19 struck.
Rather than fundamentally change things, COVID instead illuminated a number of previously overlooked problems, challenges, and trends now engulfing – if not overwhelming – every desirable place to live. And as is true for all these other places, Jackson Hole doesn’t have the first clue what to do about it.
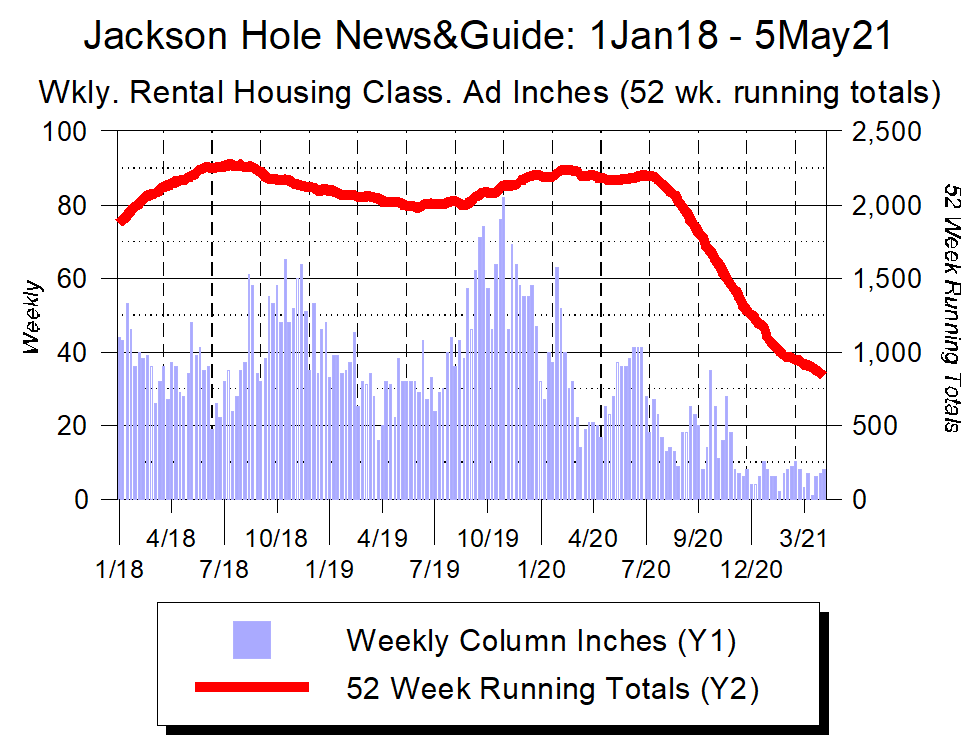
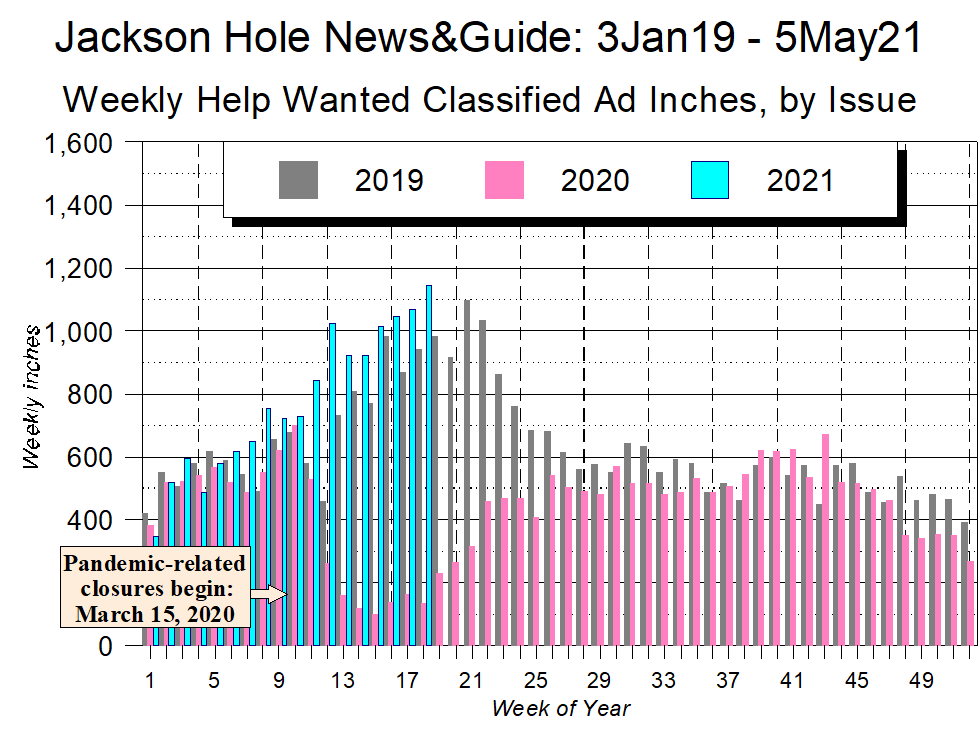
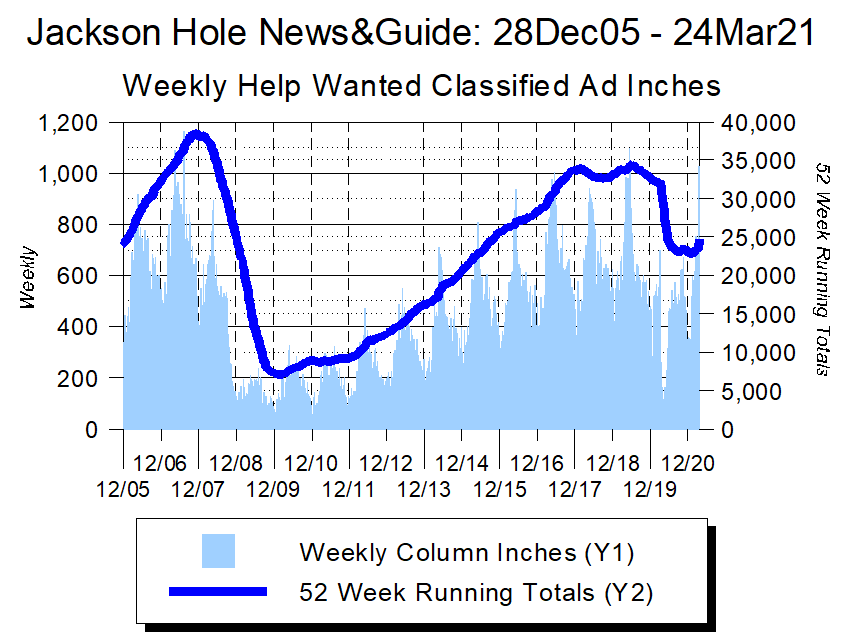
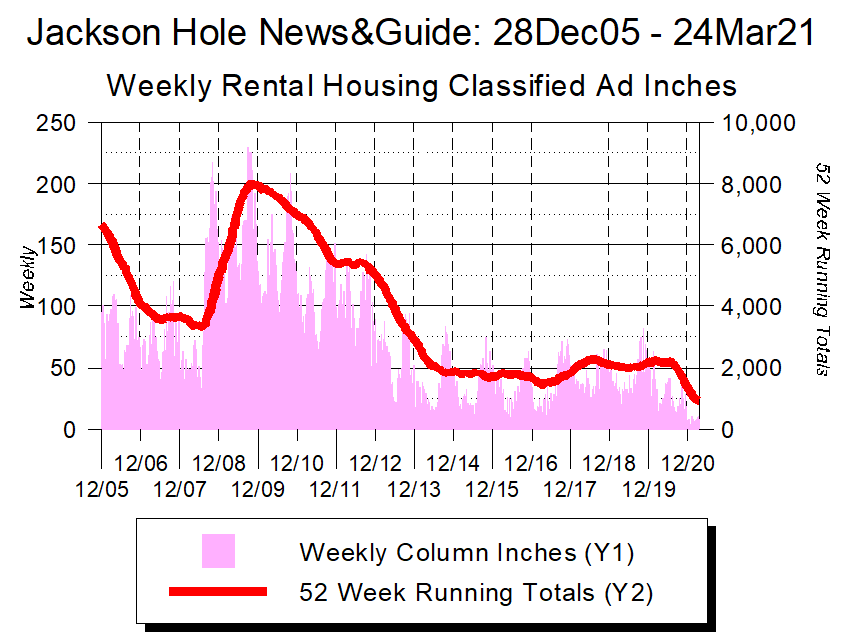
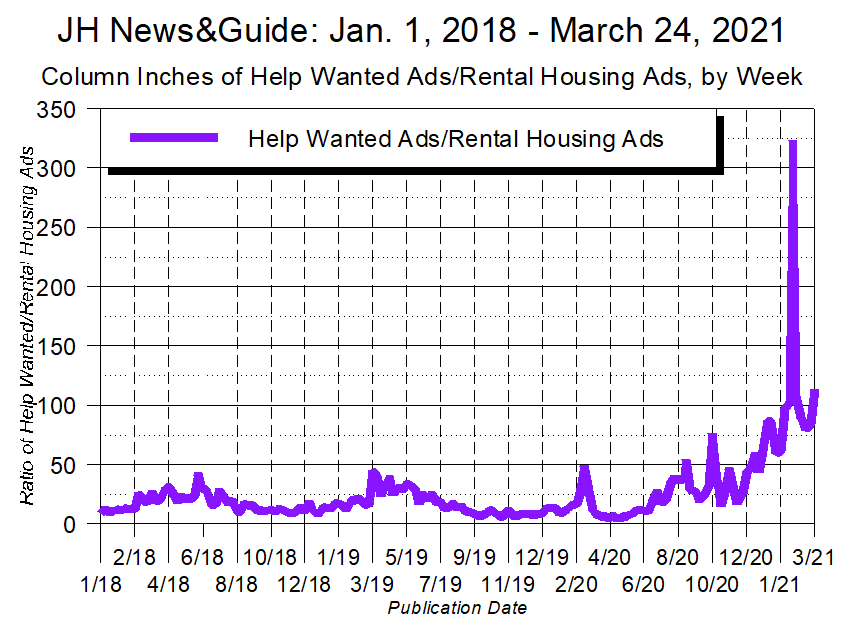
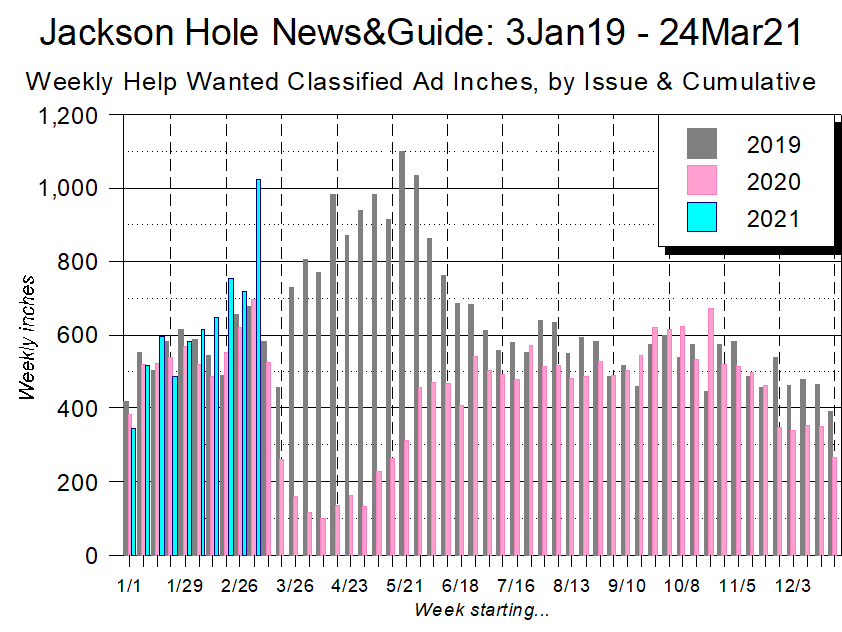
Second, like all the places I visited, Jackson Hole not only has far fewer workers than jobs, it doesn’t have enough housing for those workers. For example, between March 1 and July 31, the Jackson Hole News&Guide ran a total of 20,581 column inches of Help Wanted ads versus 163 column inches of Rental Housing ads, a ratio of 126:1. Given that there are 112 column inches per page, this means that, over the past five months, the average paper has had one-and-one-eighth pages of Help Wanted ads for every one inch of Rental Housing ads.
All of which raises three questions for me.
First, is Jackson Hole’s problem one of scarcity or abundance?
By this I mean: Do we have too few workers and too little housing, or too many jobs and too much economic activity? Conventional wisdom suggests the former, but arguably the “we’re too busy” explanation is just the other side of the same coin.
Second, is tourism’s business model still workable?
As an industry, tourism’s basic model is to hire a ton of people at relatively low wages. That this model is struggling – not just in Jackson Hole but in literally every other place I visited in the last eight weeks – suggests a systemic problem, one being exposed by this summer’s travel-related pressures.
Thinking bigger still, is there perhaps a fundamental problem with our larger economic system? The large-and-growing issues surrounding America’s large-and-growing income and wealth inequality suggest there might be.
Finally, in Jackson Hole, is the tail of commerce wagging the dog of community?
As the essay below suggests, Jackson Hole is experiencing record-setting everything: visitation, taxable sales, traffic, and so much more. Yet save for tourists, few people seem happy. Not employees. Not business owners. Not seasonal residents nor locals.
Which begs the question: We may be booming, but to what end? Are we a better, happier place because we’re raking in money? And not just from tourists, but from our exploding investment, real estate, and remote-working economies?
When even business owners tell me we’re too busy, one has to wonder.
This newsletter is not the tool for answering these questions. But at a minimum, if you’ve been feeling overwhelmed by this summer – heck, by the last couple of years – perhaps you can find some solace in knowing you aren’t alone in feeling that way.
As always, thanks for reading, thanks for your on-going support, and I look forward to hearing from you.
Cheers!

Jonathan Schechter
Executive Director
PS: I Need Your Help, Please
In all the work I do, my goal is to offer new insights into important issues, and do so in an easy-to-understand fashion.
With luck, I succeed more often than not. But what never fails to surprise me is how much time and effort it takes to do the work. For example, it took me a week to produce this newsletter – to find the data, make sense of them, create the graphics, figure out what in the world I wanted to say, and then say it in what I hope is a coherent and accessible fashion.
The same is true for the other work I take on. To offer another example, the half-day 22 in 21: Tourism conference I staged in May took several weeks to pull together, and that was after several months of preliminary work.
I anticipate far more of the same during the upcoming months, when I plan to stage two or three more 22 in 21 conferences, as well as return to a regular newsletter schedule (I suspended them during my summer travels).
I mention all this because this work takes time, time is money, and I simply cannot do the work without financial support.
As is the case for so many Jackson Hole non-profits, my Charture Institute relies on donations given through Old Bill’s Fun Run, for the matching funds Old Bill’s provides are extraordinarily valuable to small organizations like Charture.
Will you please support CoThrive, 22 in 21, and Charture’s many other efforts by making a donation through Old Bill’s Fun Run? Click here to go to the Charture-specific donation page.
Thank you so very much.
Who is Benefiting from Our Current Boom?
Stars live for millions of years, but even they are not infinitely sustainable.
Most stars are fueled by hydrogen, which nuclear fusion converts to helium. Eventually, as their hydrogen supply diminishes, stars start burning that helium, which in turn triggers a seemingly paradoxical phenomenon: the star’s interior begins to contract into its core while, simultaneously, its exterior grows larger and shines brighter.
This marks the “red giant” phase of a star’s life, one which eventually comes to a quick and spectacular end when the star collapses in on itself after burning through the hydrogen, helium, and other resources sustaining its existence.
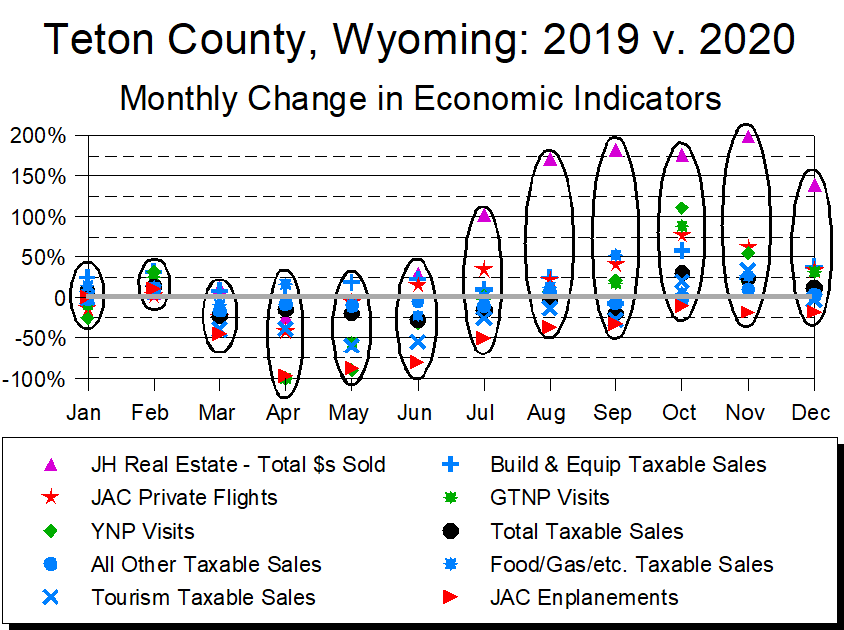
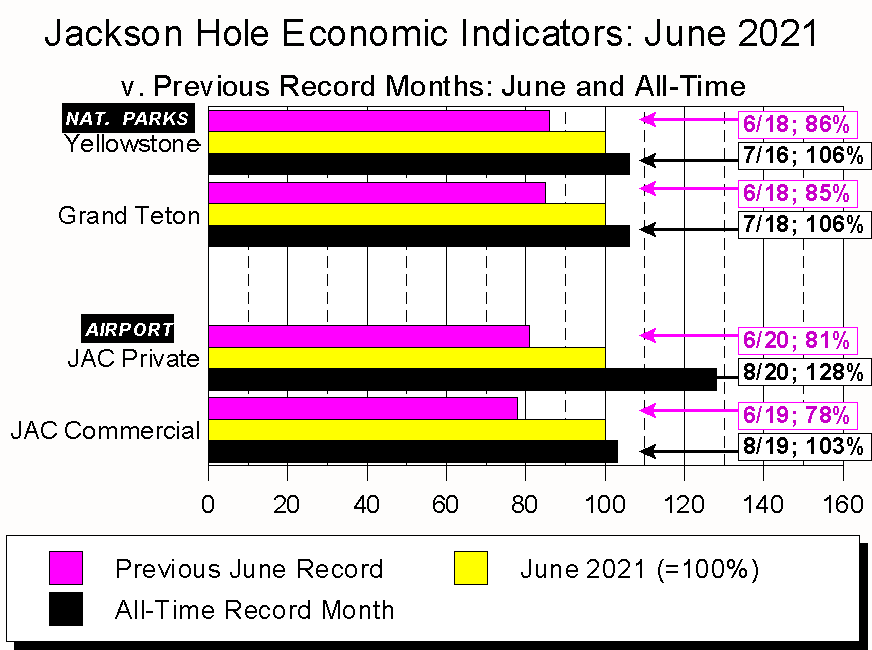
I mention this because red giants came to mind when I received Teton County’s most recent economic indicators. Specifically, in June 2021:
- Teton County’s merchants sold an all-time record amount of taxable goods;
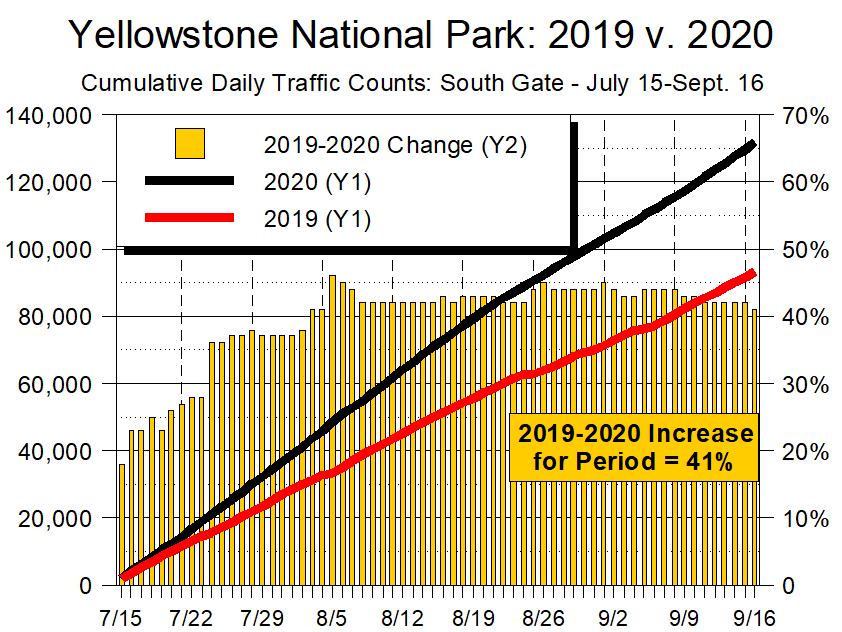
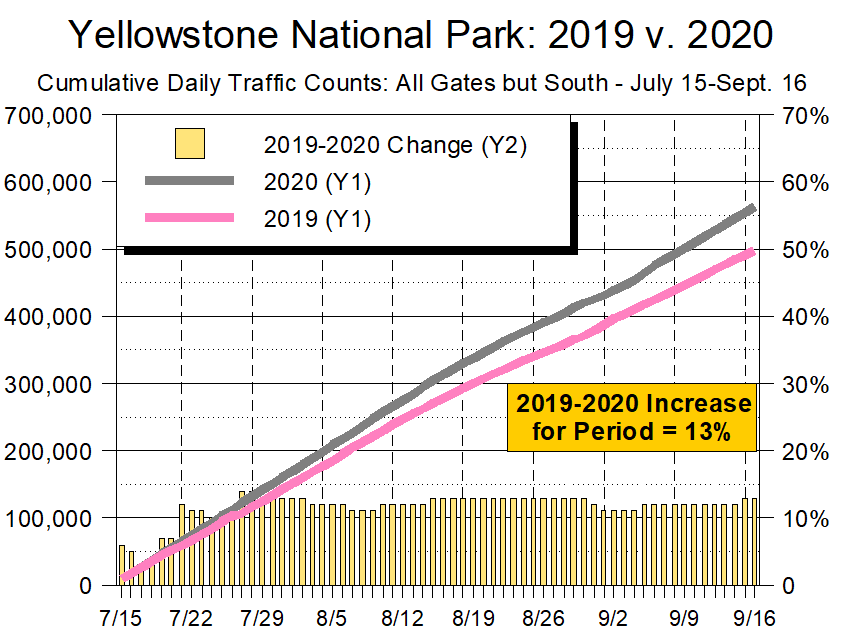
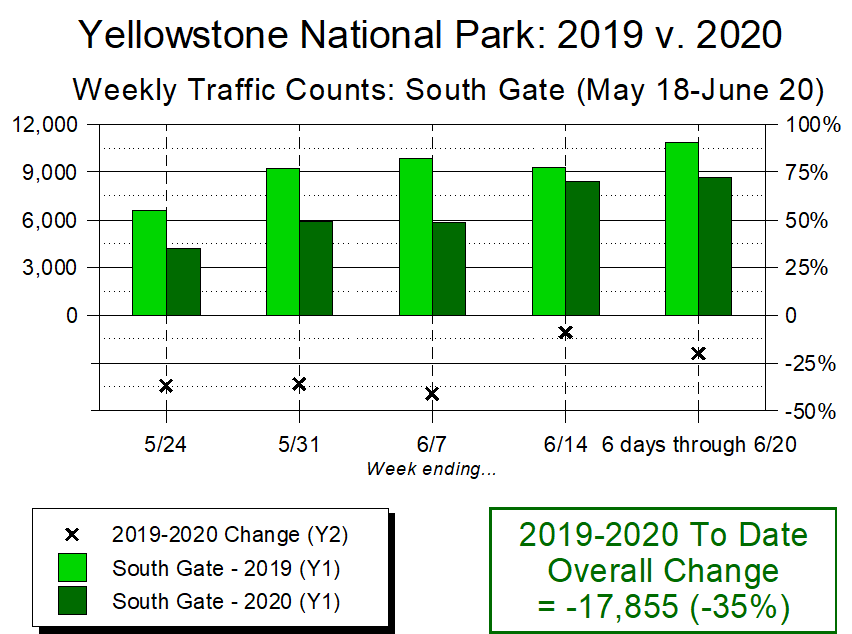
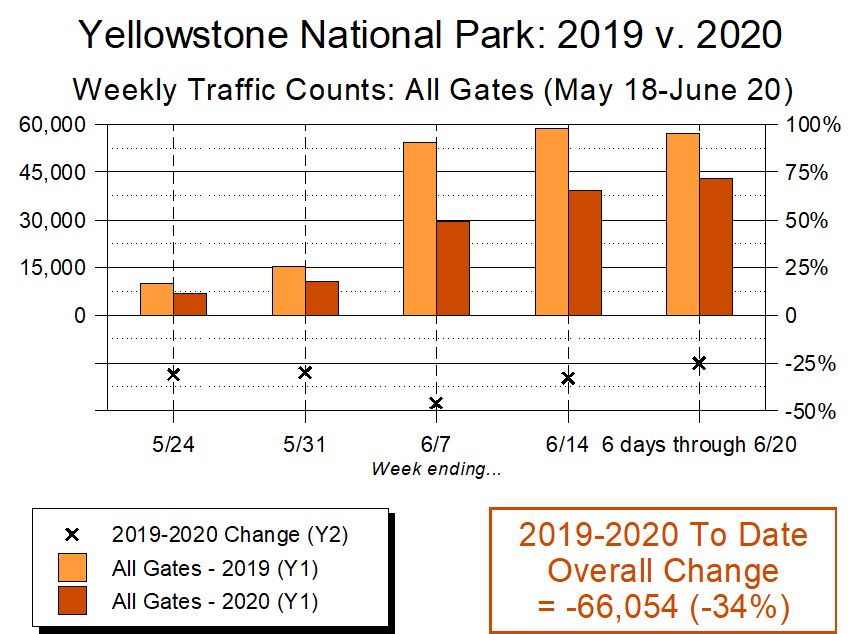
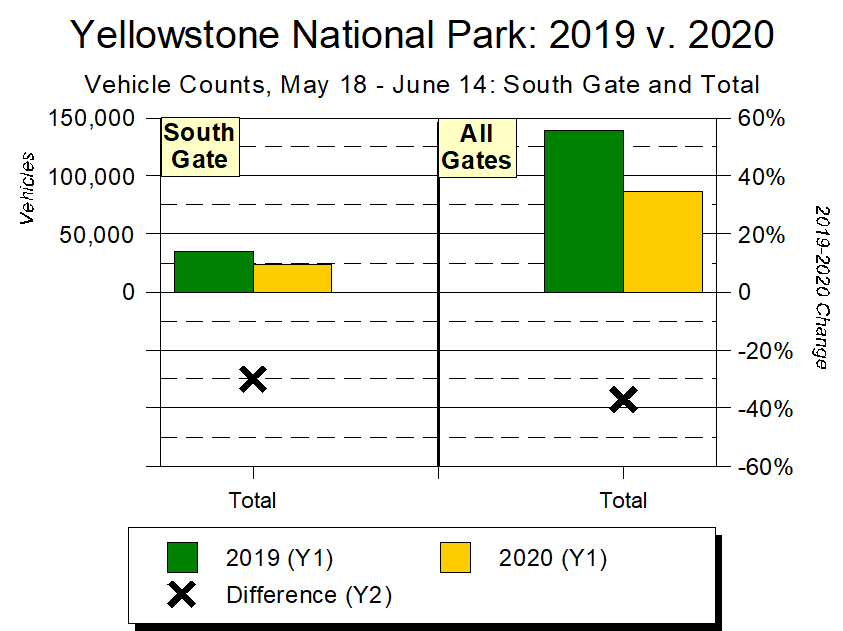
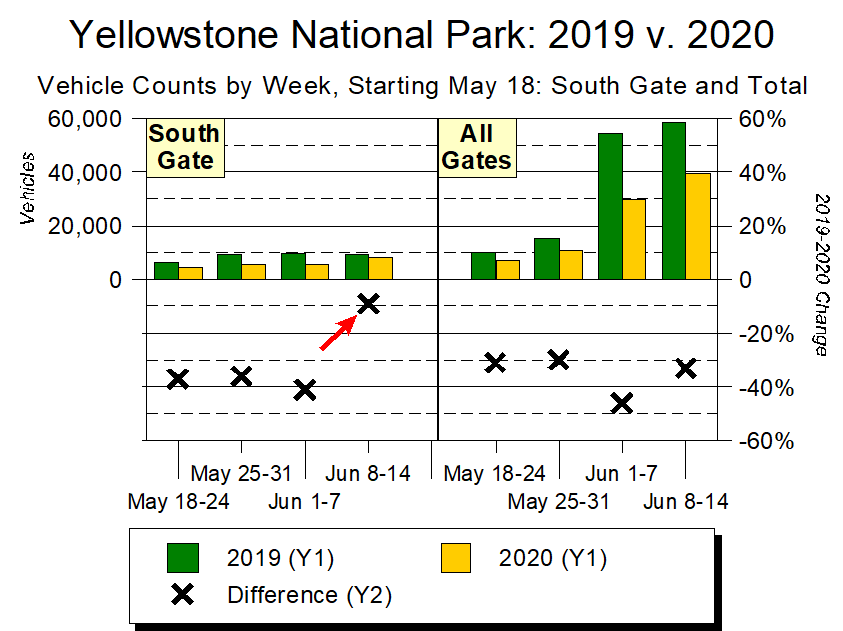
- Teton County’s roads carried an all-time record number of vehicles for June (June 2021’s record traffic counts were quickly eclipsed by July 2021’s);
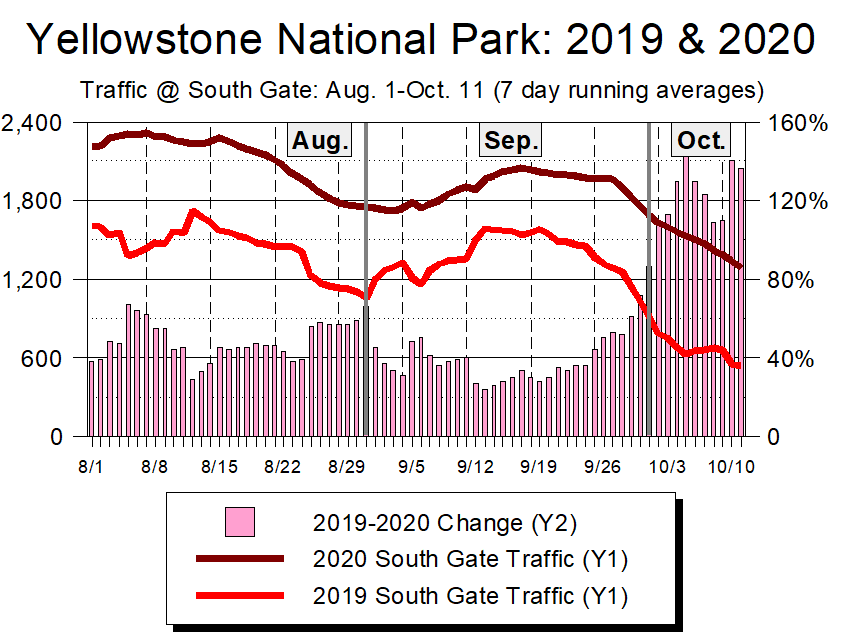
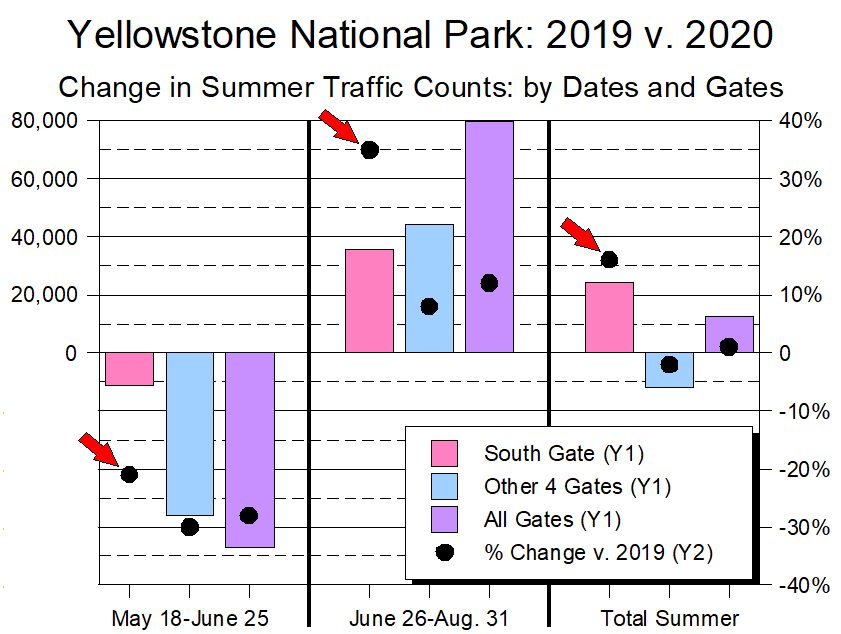
- Both Yellowstone and Grand Teton National Parks set June visitation records (July 2021’s figures will almost certainly be higher); and
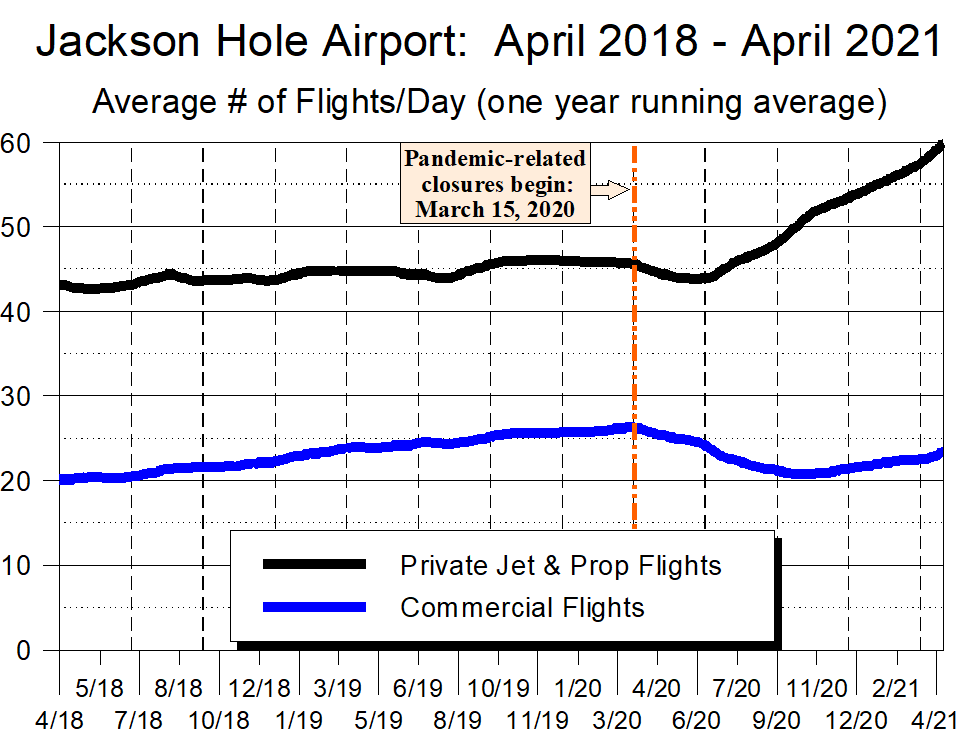
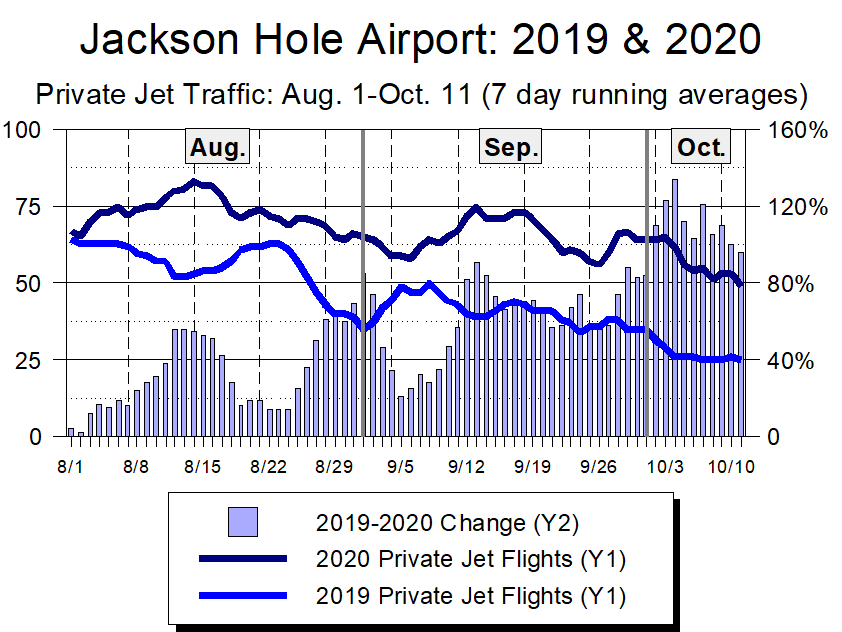
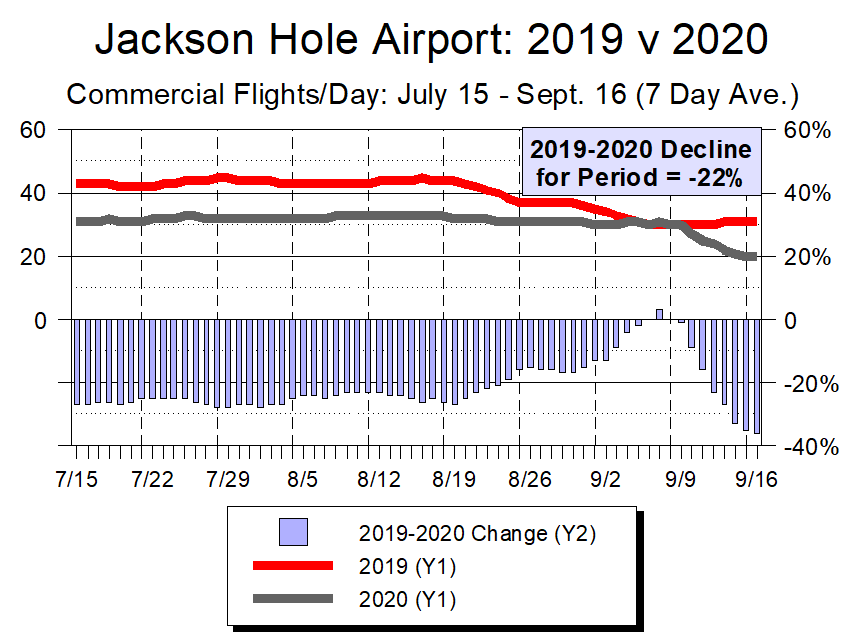
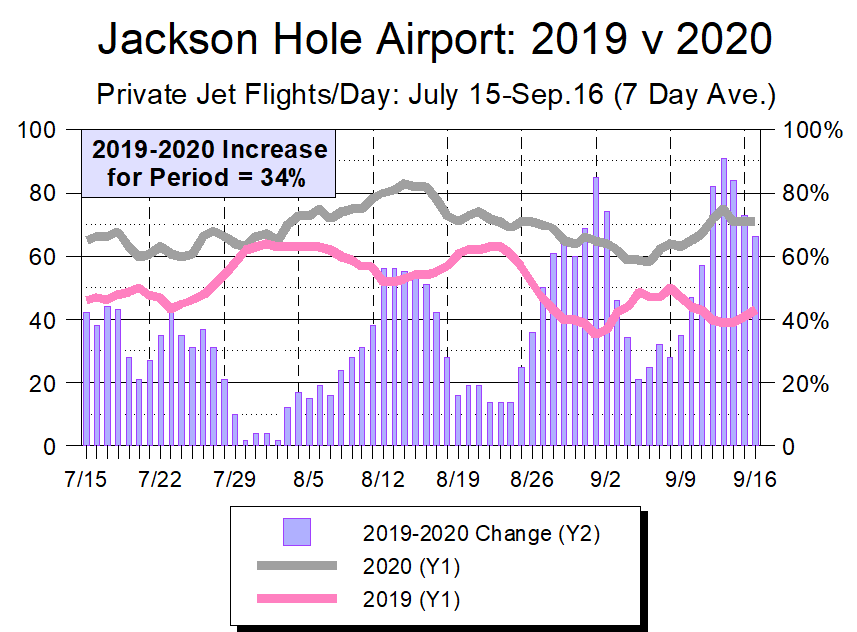
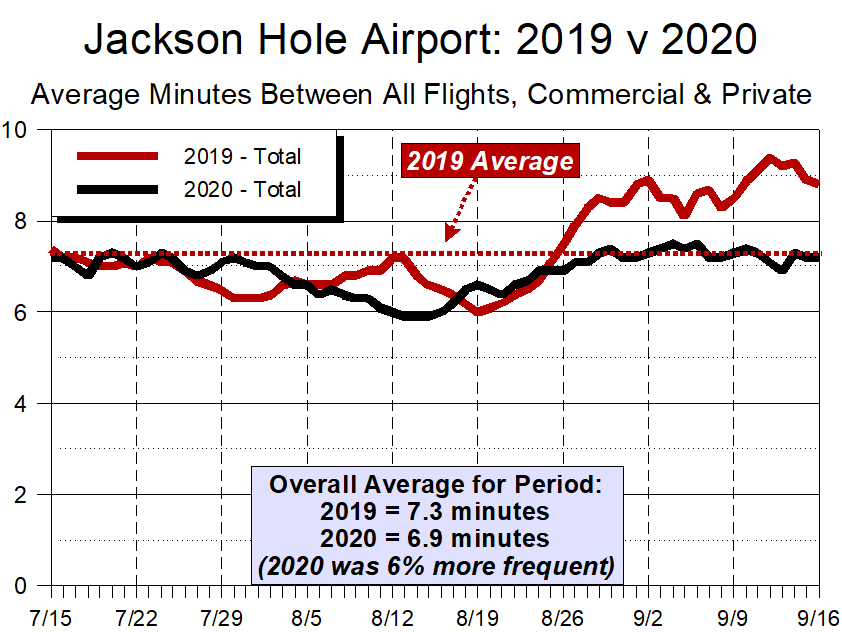
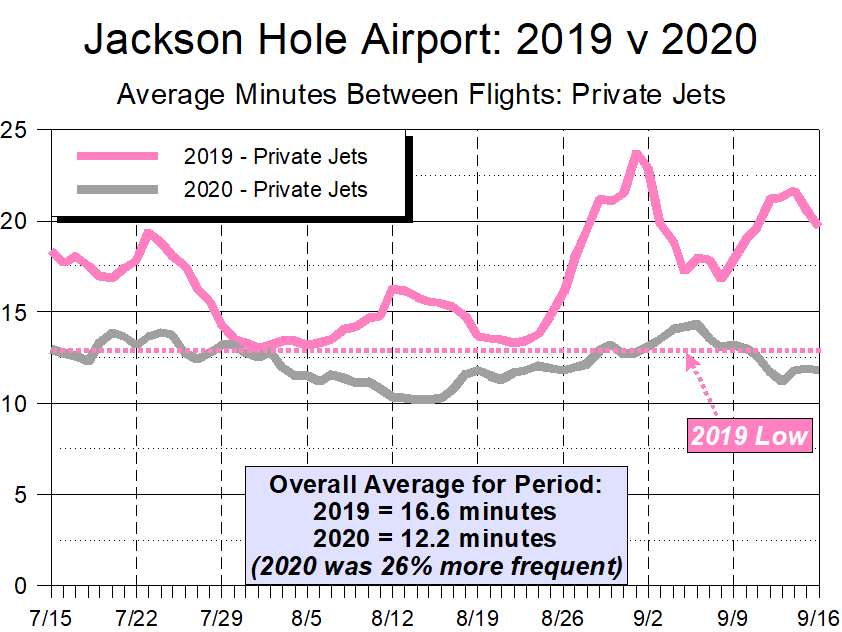
- The Jackson Hole Airport set June records for both commercial airline passengers and private plane activity (ditto).
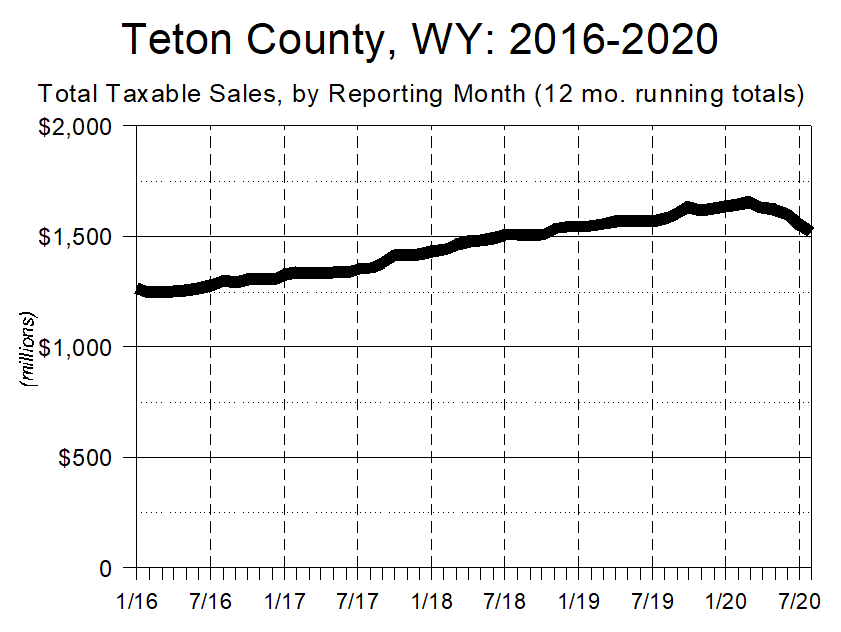
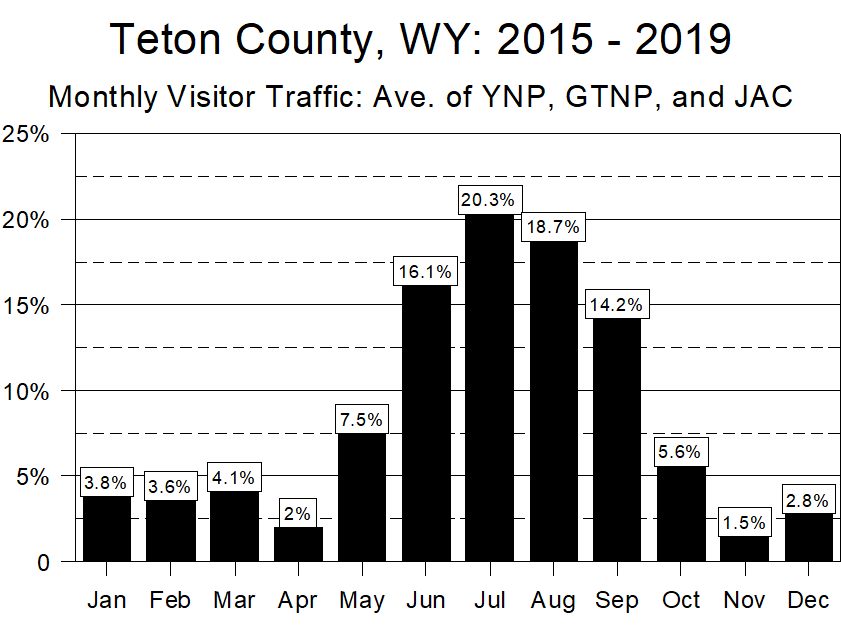
Graphs 1a and 1b shows just how crazy June 2021 was – not only was every previous June record smashed, but most of June’s numbers set or came close to setting all-time highs, regardless of month. Yet July and August are supposed to be our busy months…
At least this year, June became the new July, leaving July to explore uncharted seas.
Graph 1a
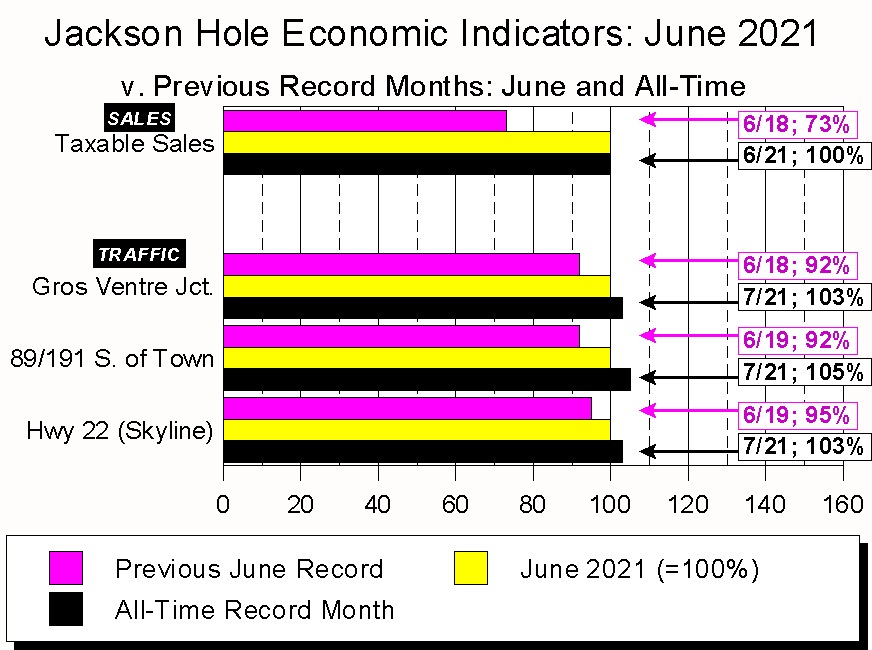
Graph 1b
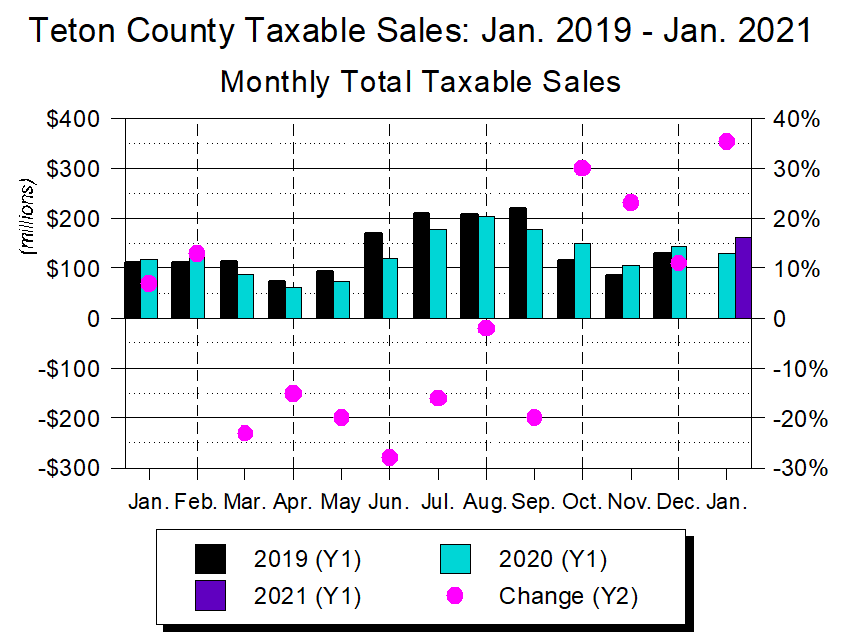
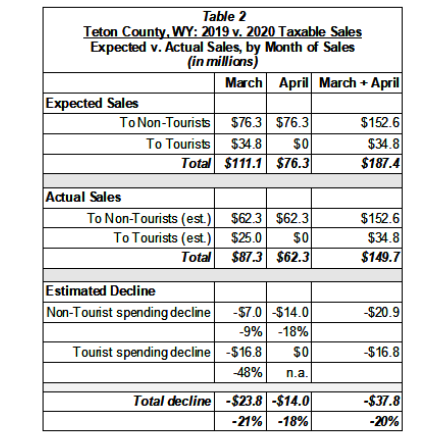
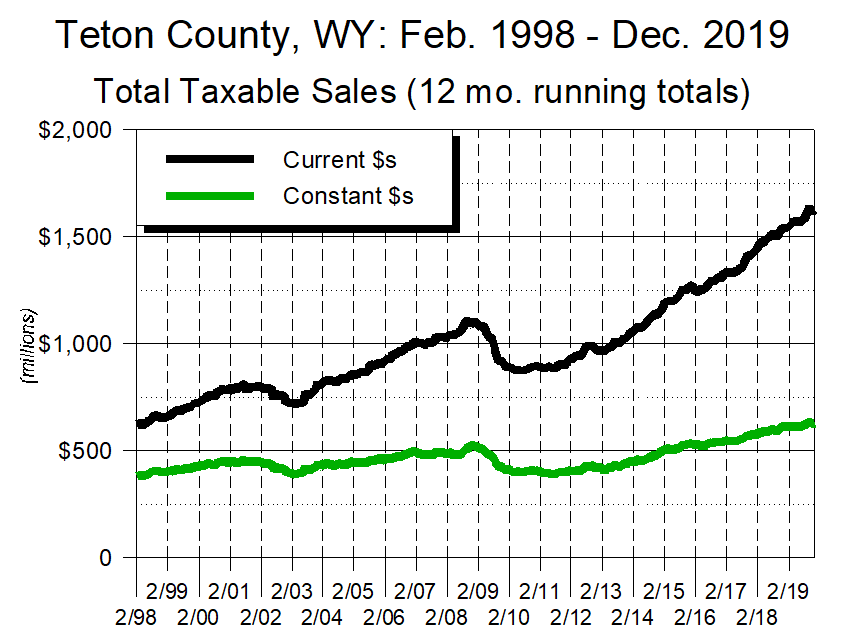
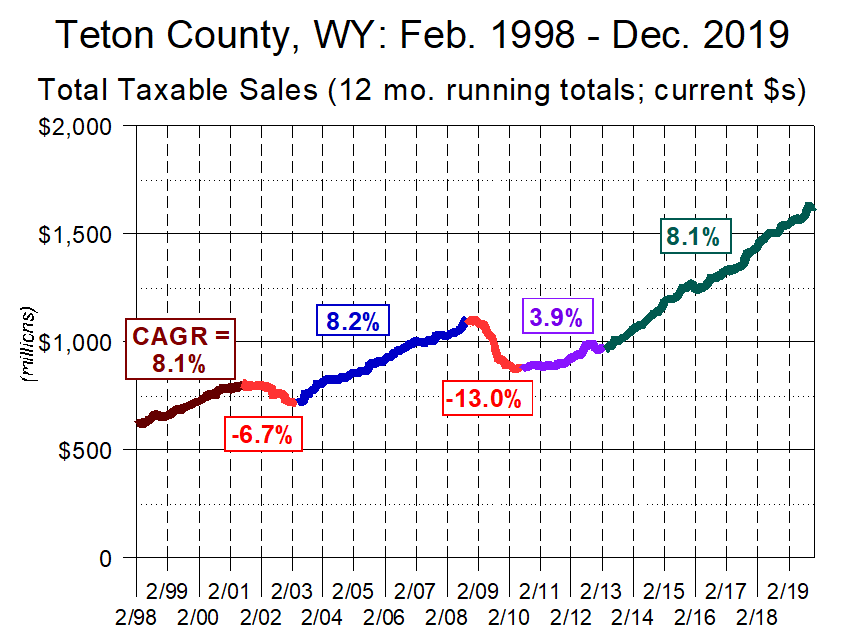
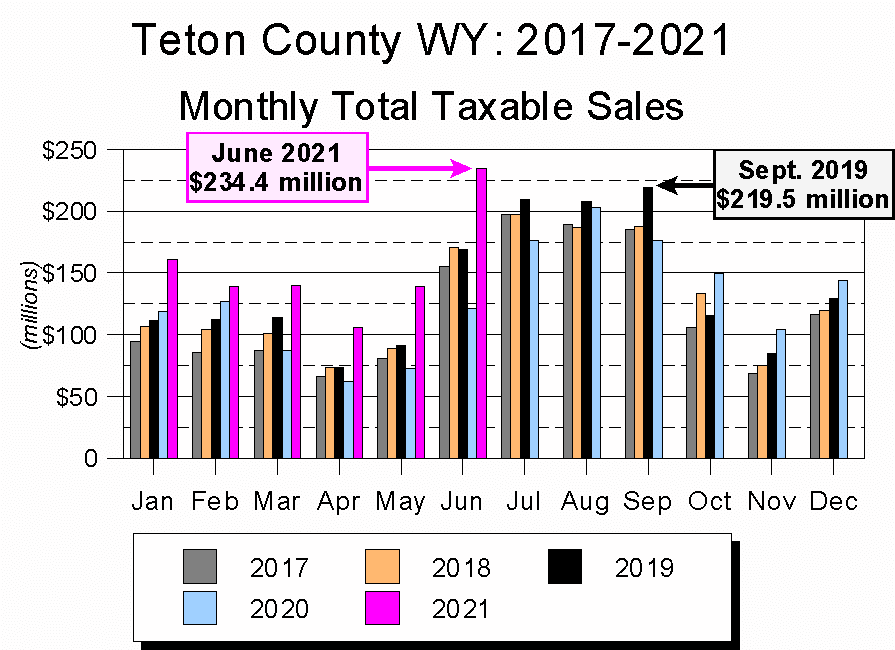
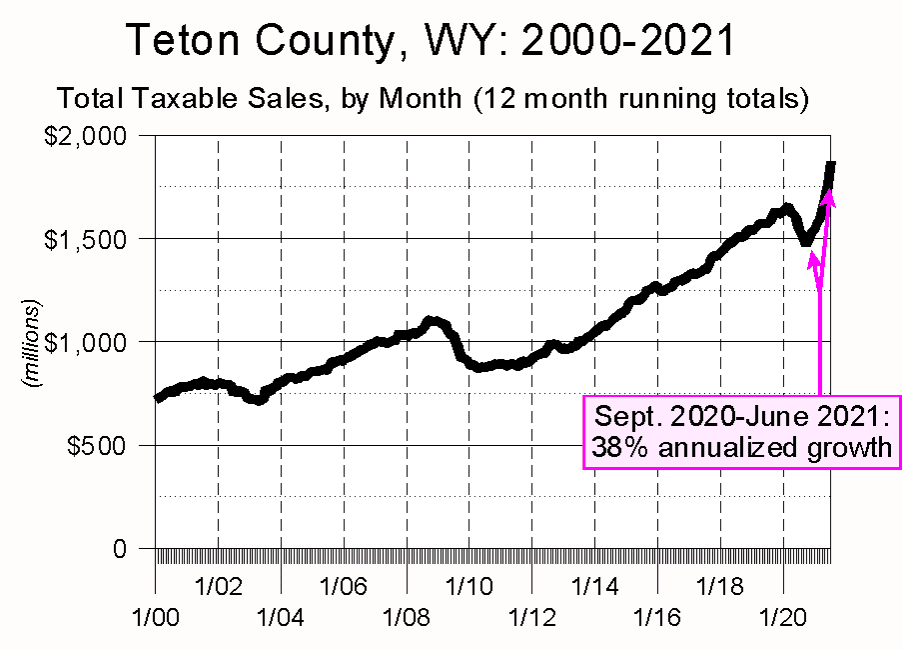
June’s sales tax numbers are worthy of a little extra attention because, as Graph 2 shows, June 2021’s taxable sales were 6.8% higher than those in September, 2019, the previous record-holding month. And as Graph 3 shows, June’s sales were so strong that they powered our economy well beyond where we were when COVID hit.
Graph 2
Graph 3
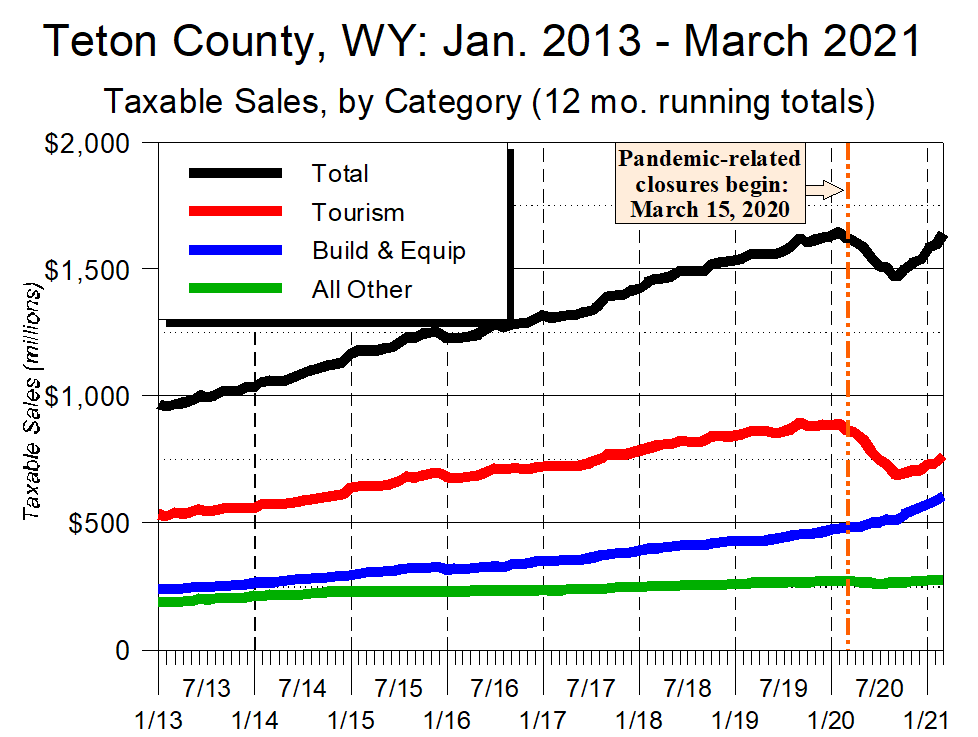
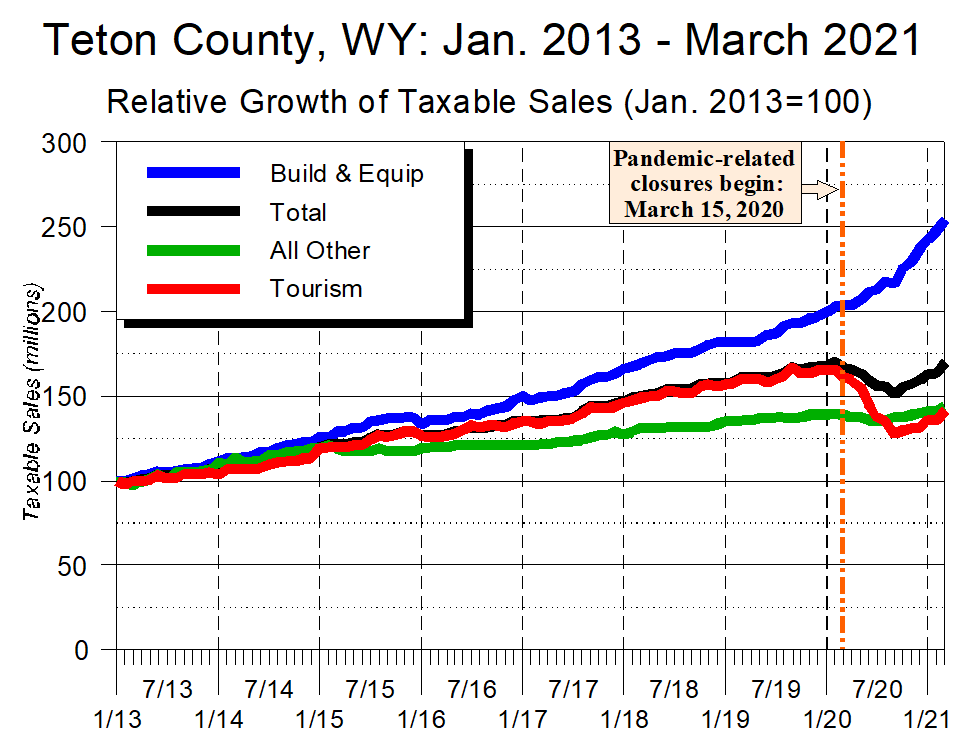
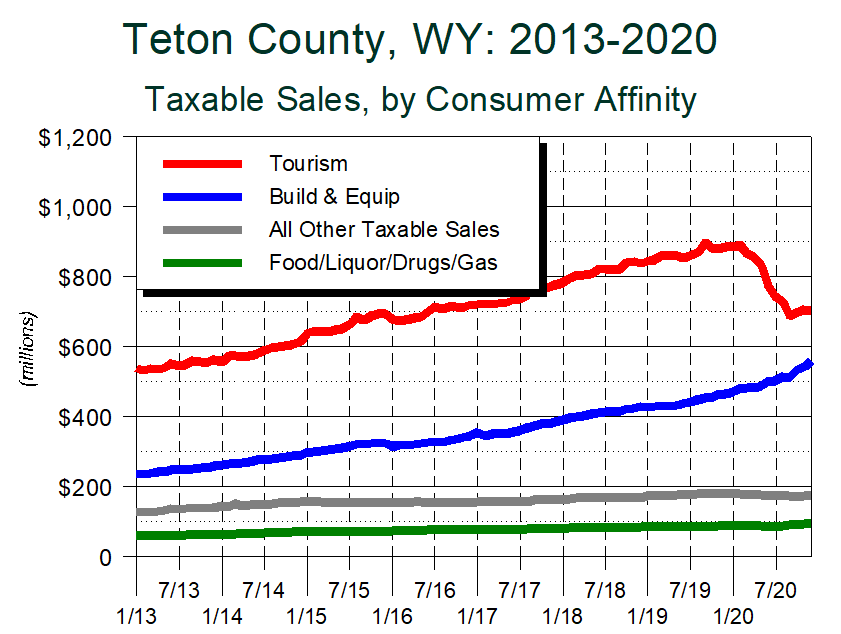
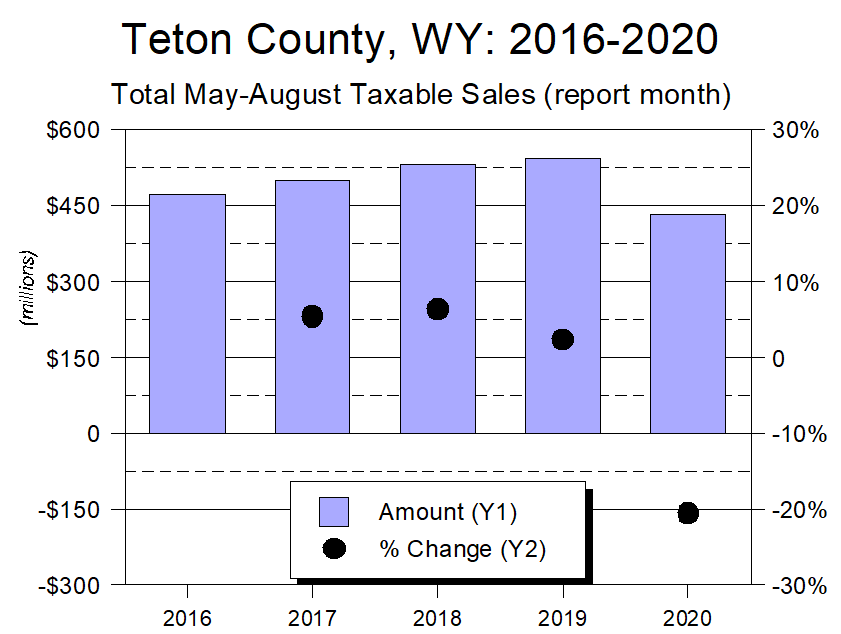
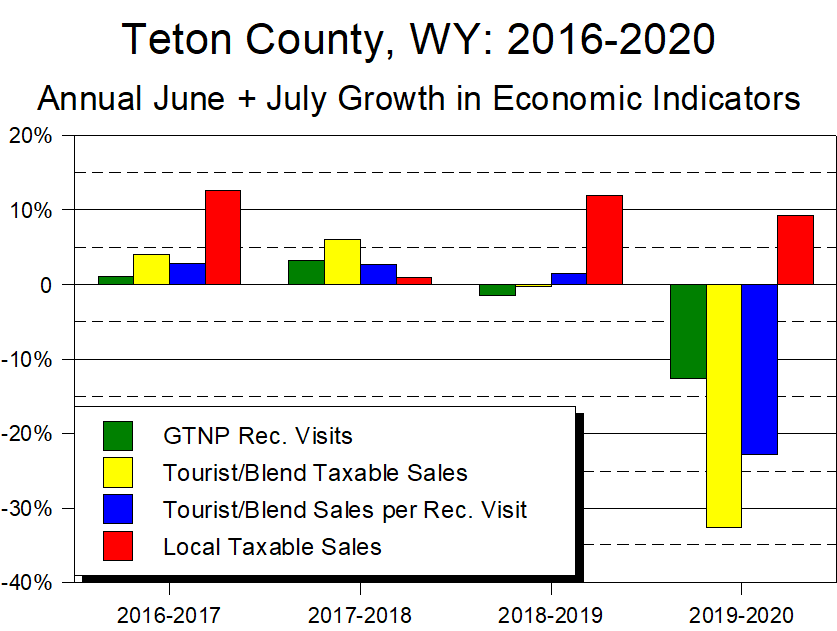
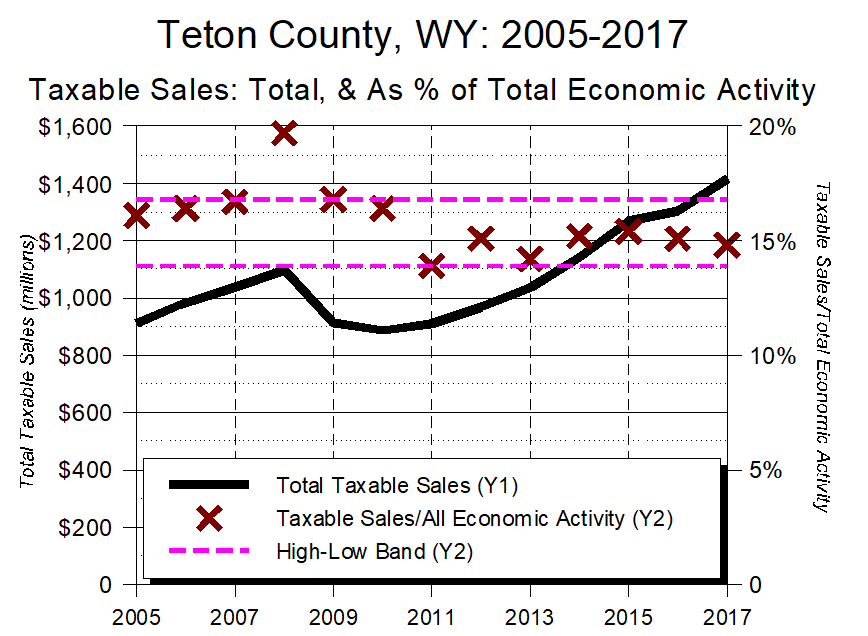
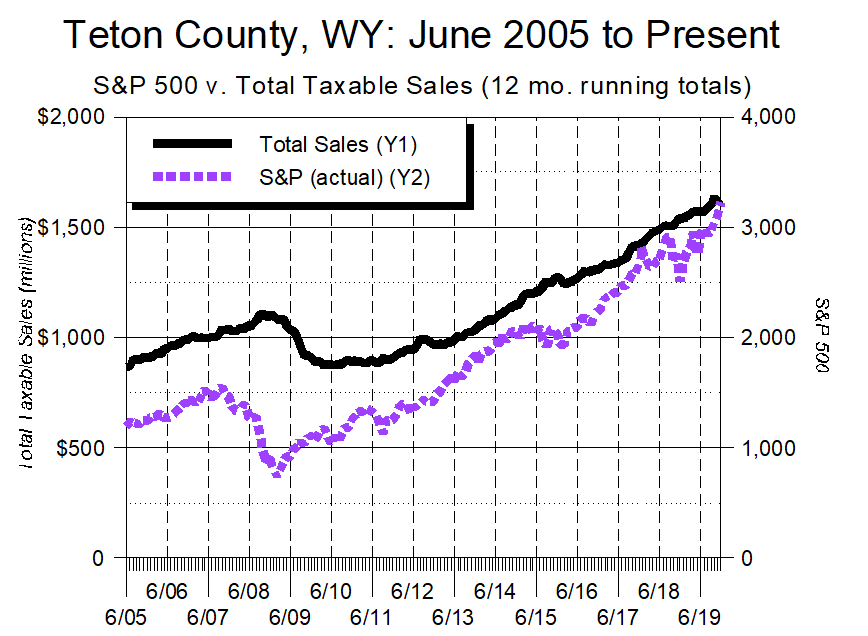
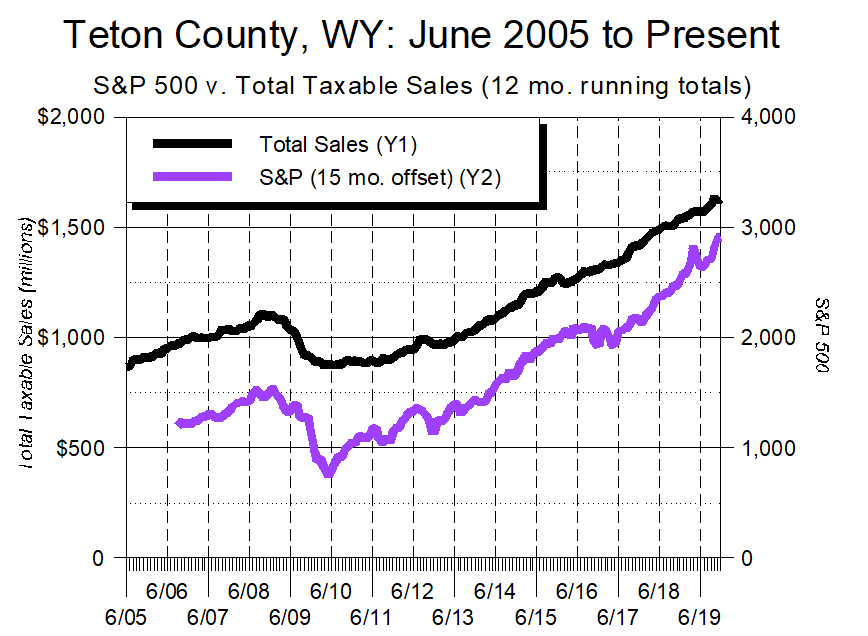
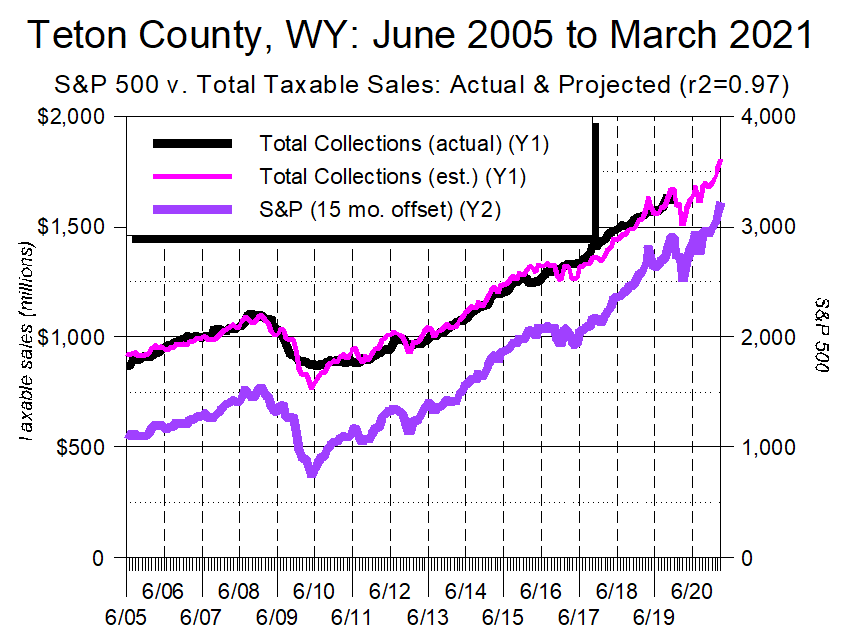
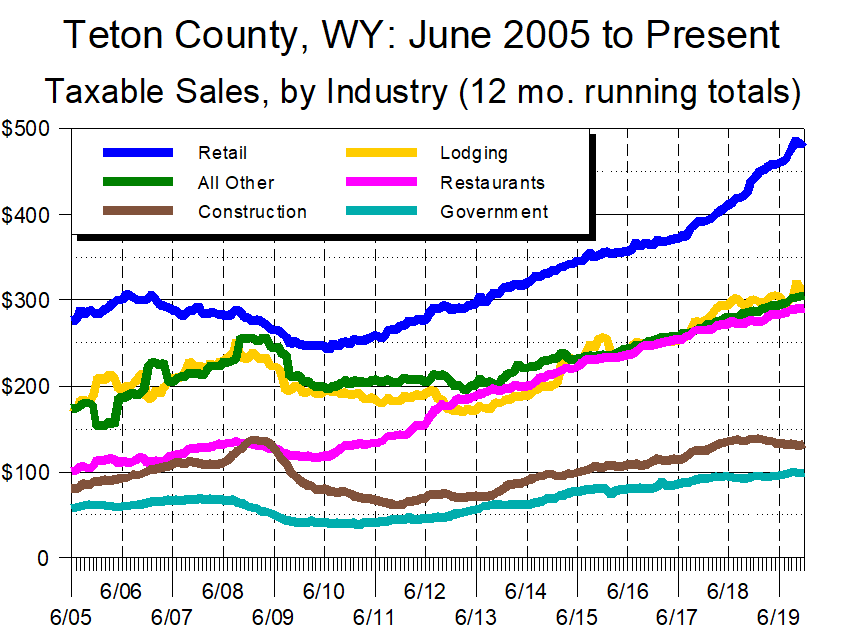
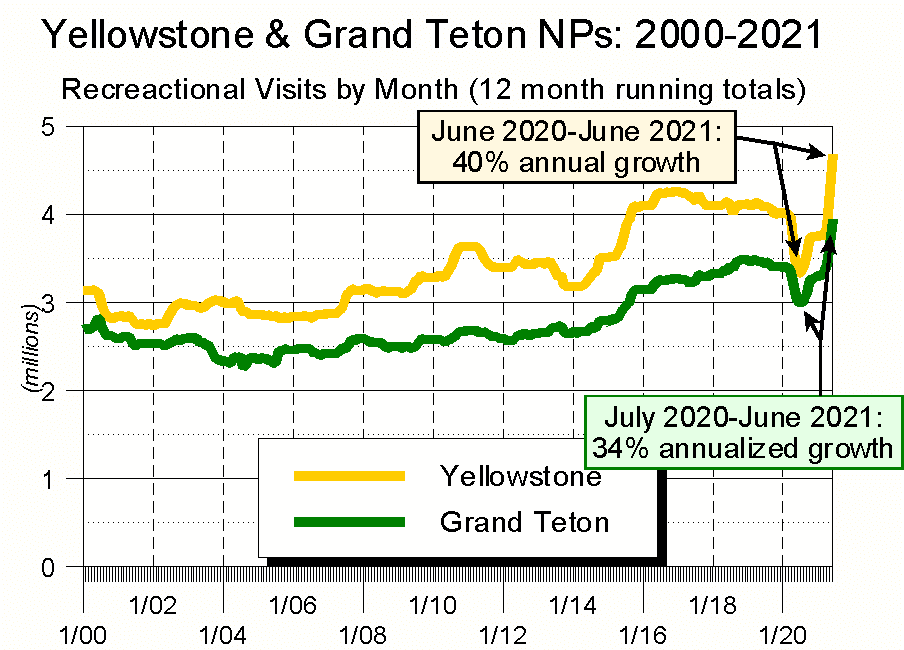
While our sales tax boom was clearly correlated with our recent tourism boom (Graph 4), if we want to understand Jackson Hole’s taxable economy it’s actually more instructive to look at what happened during the COVID downturn.
Graph 4
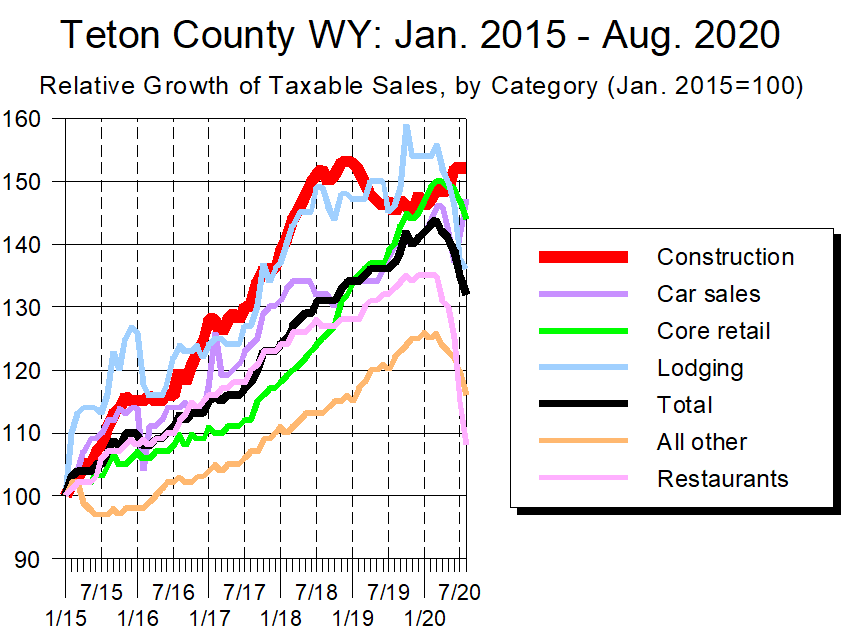
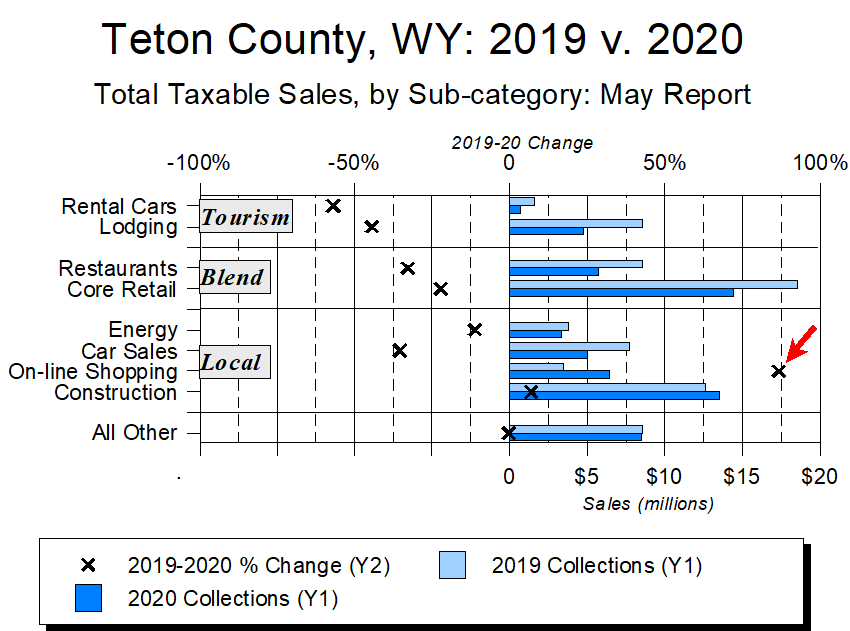
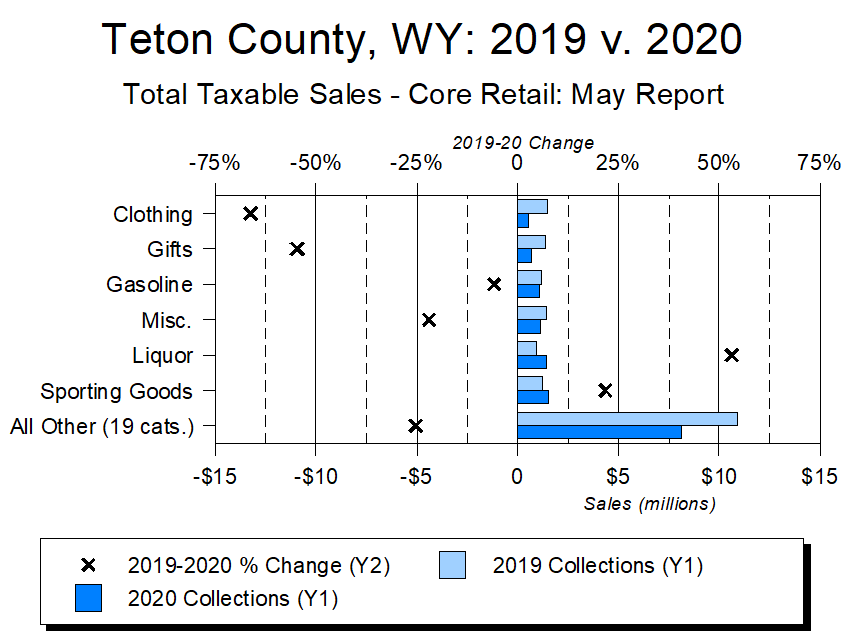
Using the classifications provided by the state, Teton County’s taxable sales can be broken down into seven basic categories. In descending dollar order, these are:
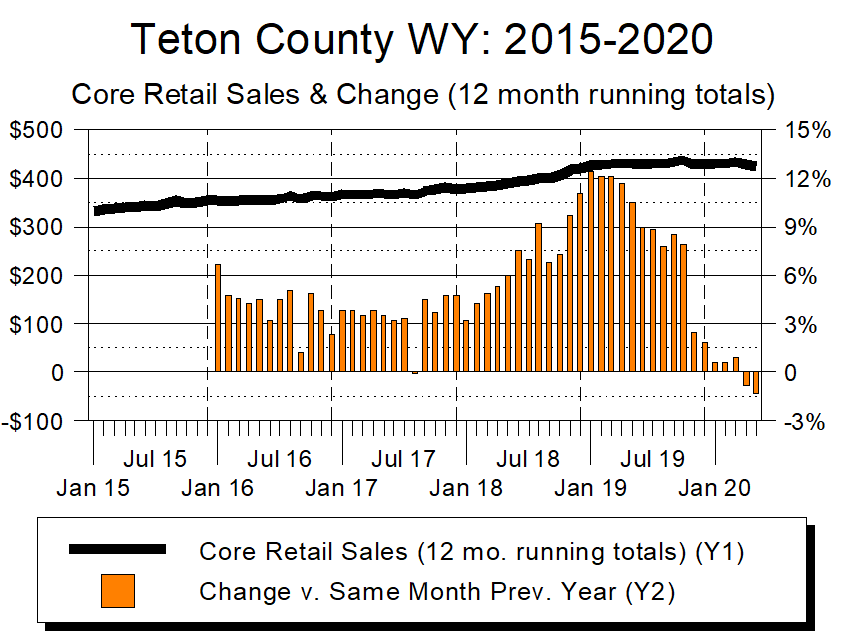
- Core Retail (i.e., storefront retail)
- Lodging
- All Other
- Restaurants
- Construction
- Car Sales
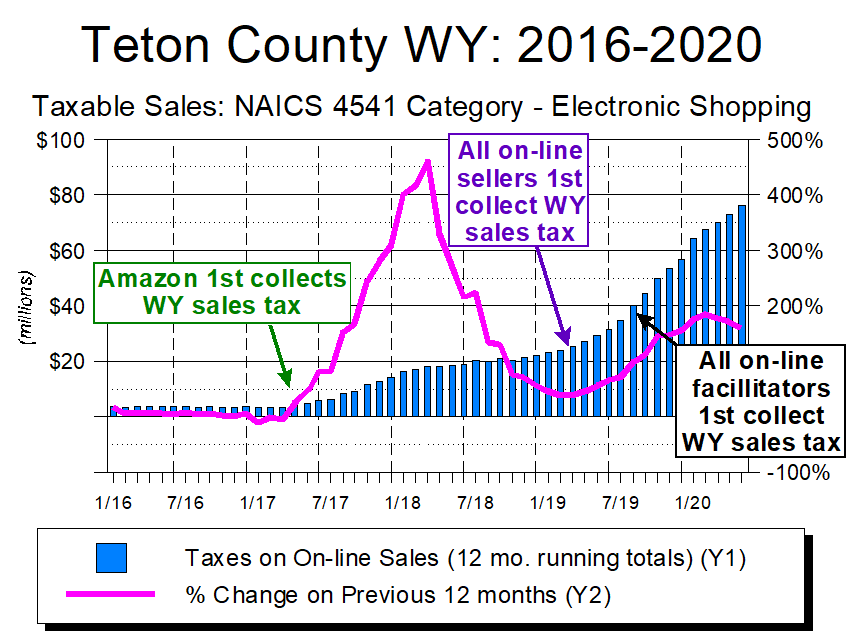
- On-line Shopping. (Graph 5)
Graph 5
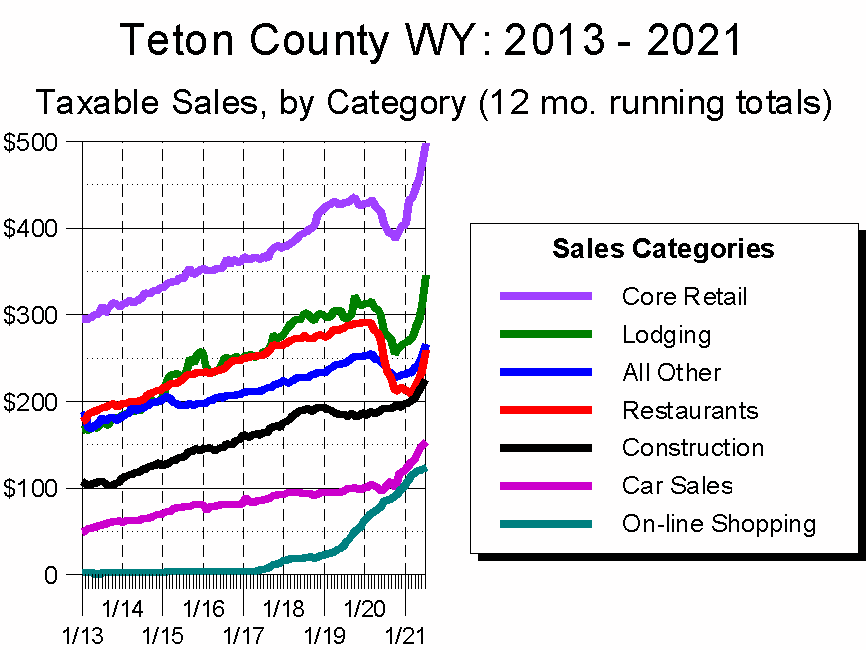
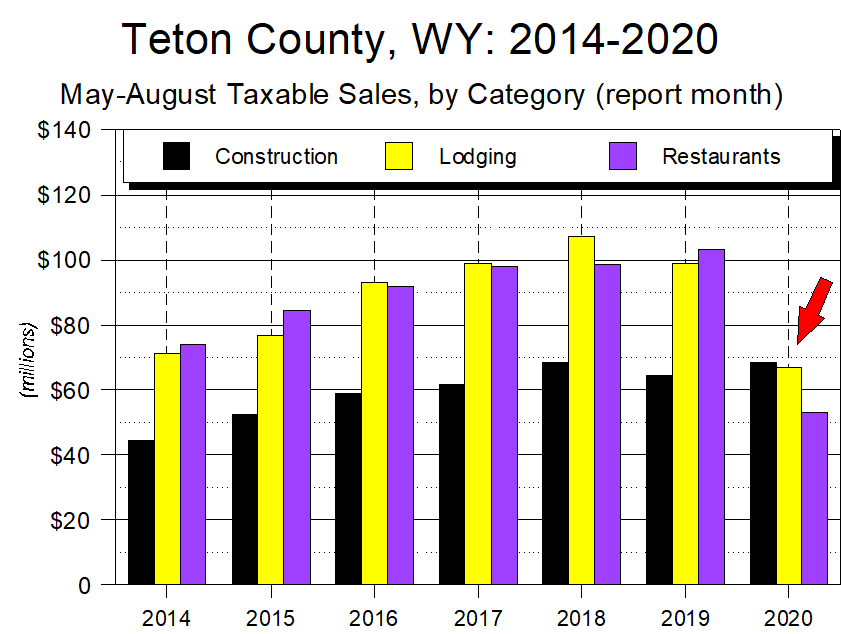
What’s notable about this graph is that the top four categories – Core Retail, Lodging, All Other, and Restaurants – were all clearly affected by COVID. And to state the obvious, Core Retail, Lodging, and Restaurants form the foundation of our tourism economy.
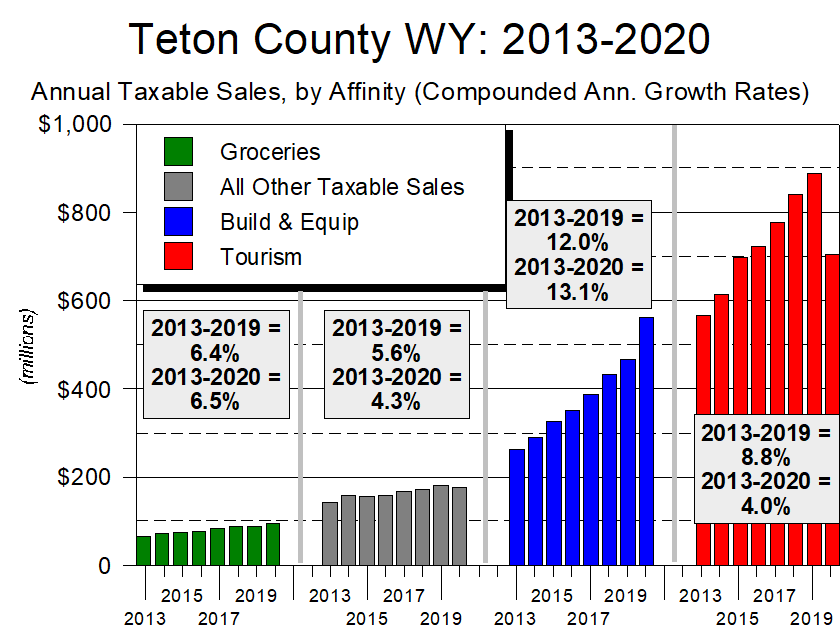
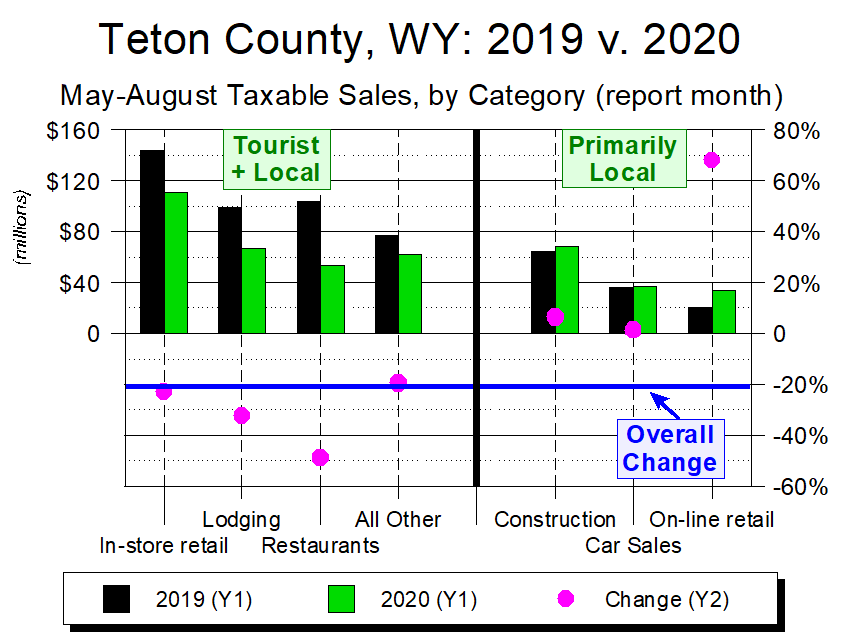
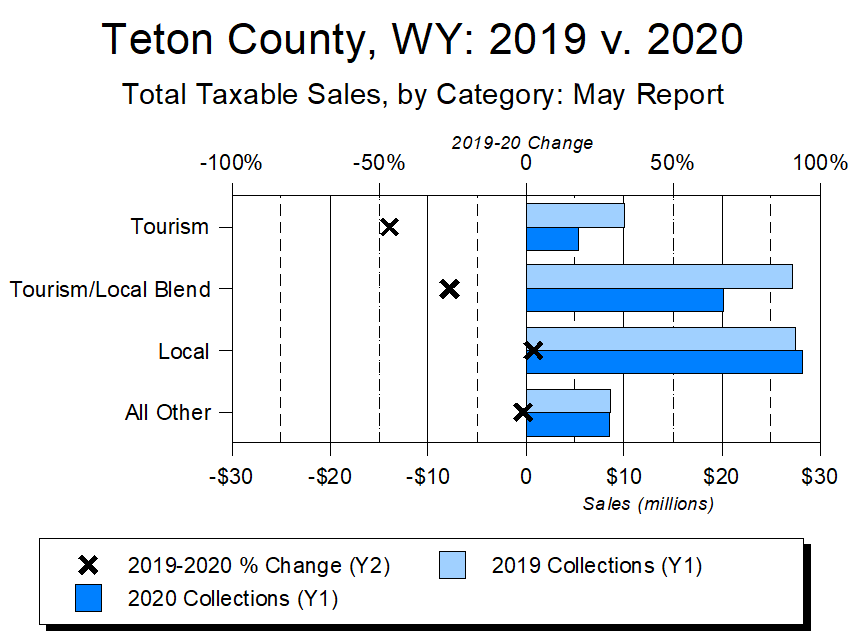
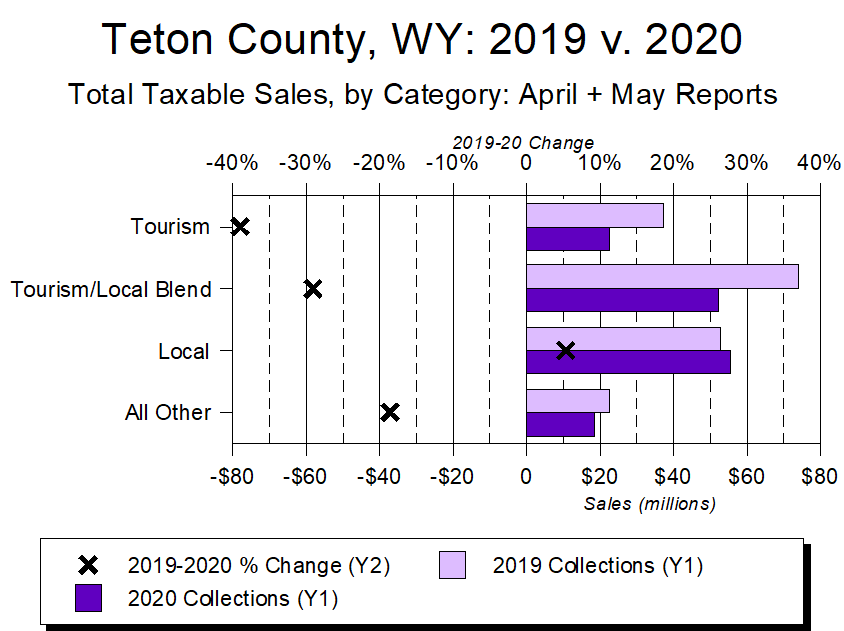
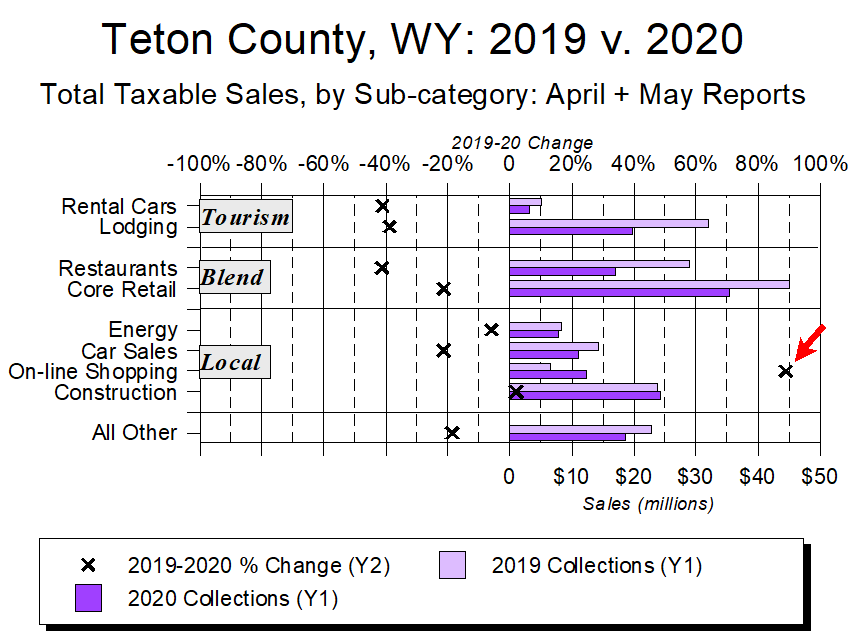
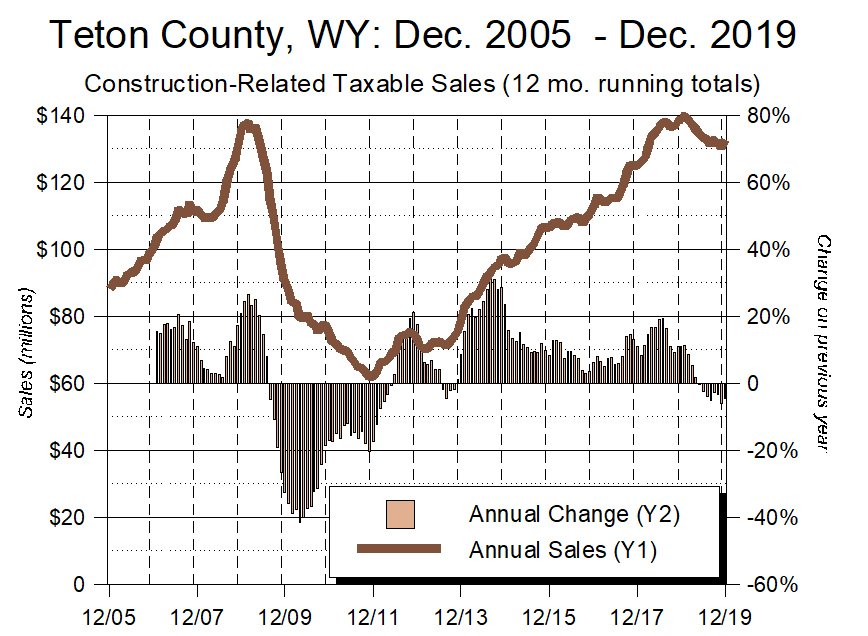
Yet the remaining three categories didn’t decline during COVID. This suggests that to fully understand what and who are driving our taxable economy, we need to look at the data through another lens. Graph 6 tries to do this.
Graph 6
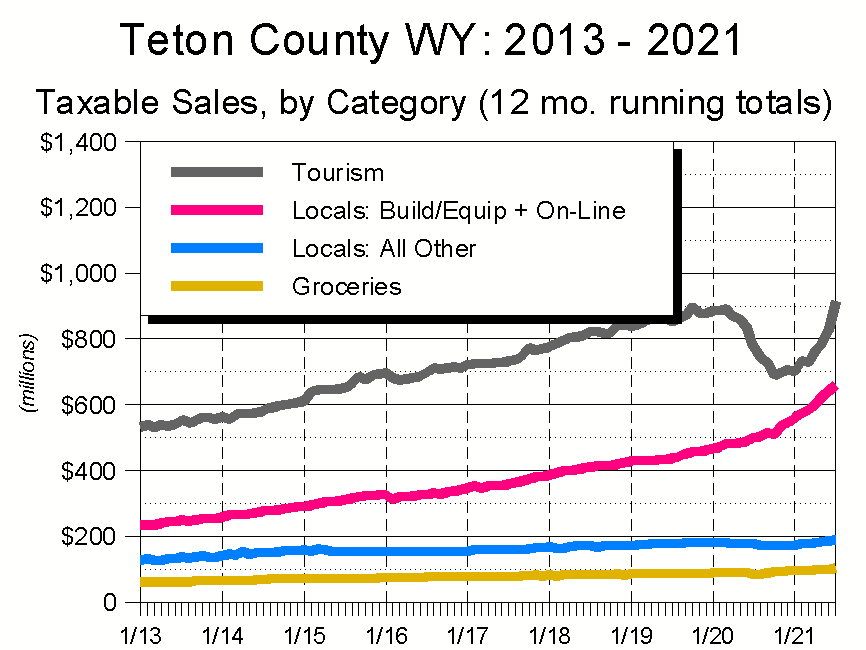
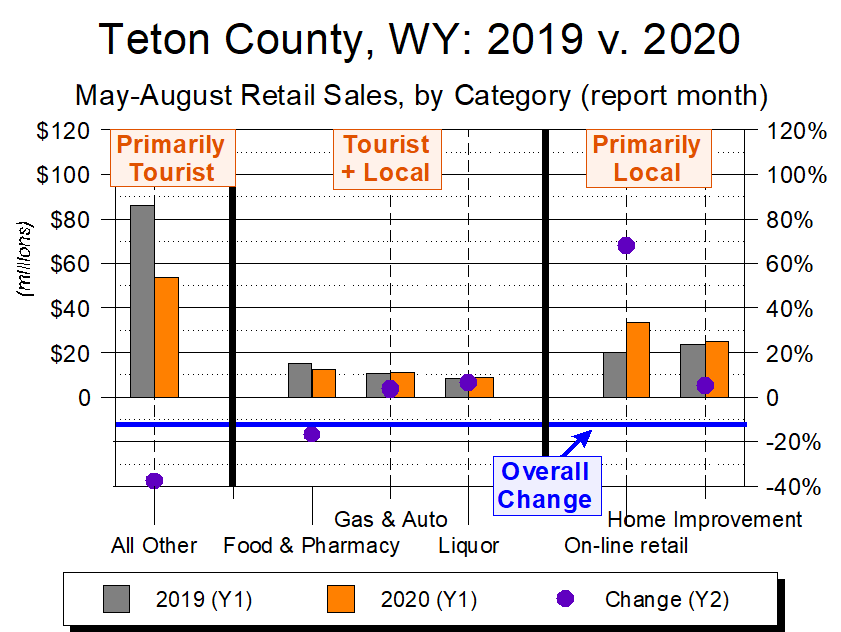
As Graph 6 suggests, while tourism is driving the recent jump in sales, the thing that really mattered during COVID (and even before) were the purchases made by locals, specifically on-line purchases and those made by folks building, remodeling, and/or furnishing homes in Jackson Hole. And when combined with Graph 7, it becomes pretty clear that while COVID affected the most visible part of our taxable economy – Tourism – the other half of our economy weathered COVID just fine, thank you.
Graph 7
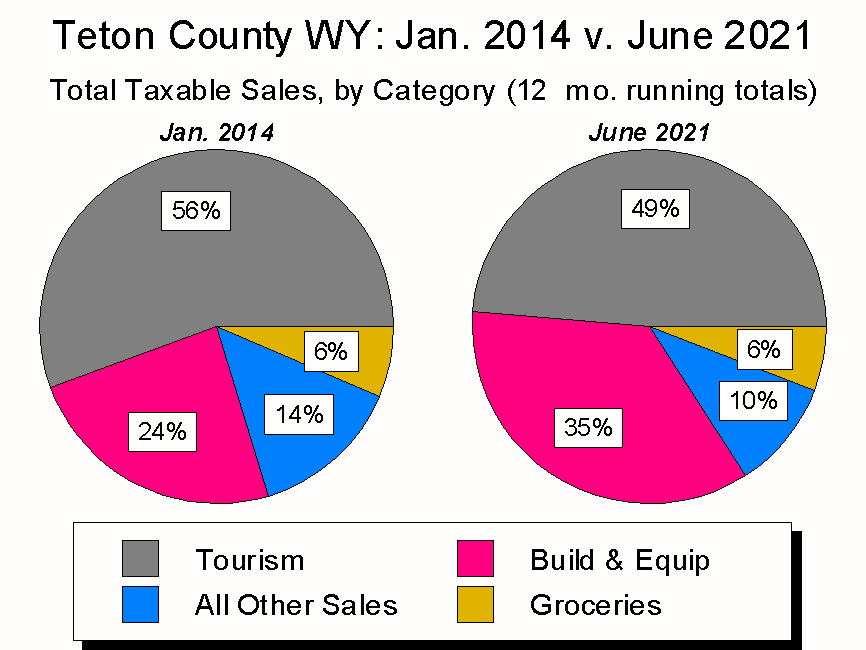
Then consider two other points.
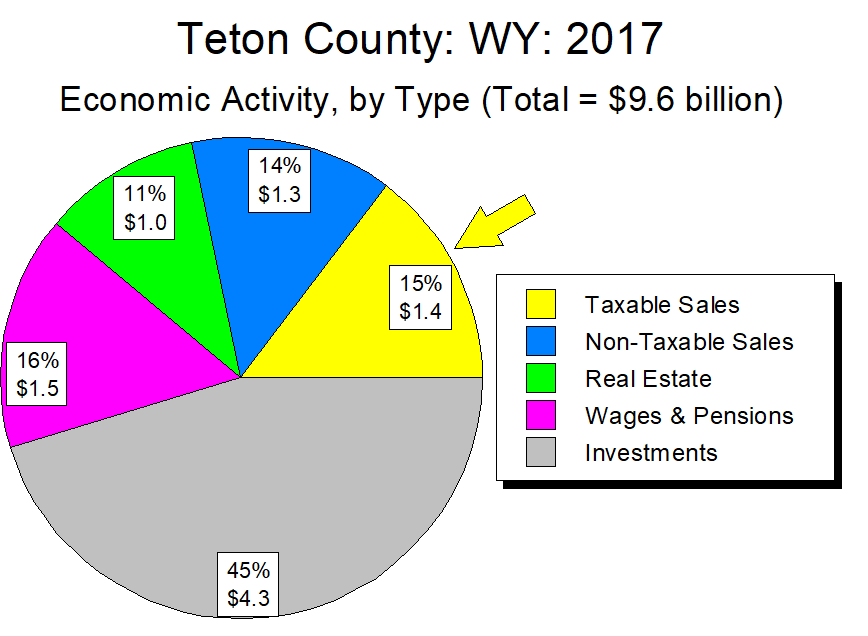
First, taxable sales account for only about one-sixth of Jackson Hole’s economy: investment income is a much bigger slice of our economic pie than taxable sales; real estate sales are about equal to taxable sales; and we have a large and growing “Zoom” economy.
Second, this other five-sixths of our economy exploded last year.
Add it all together, and it becomes easier to see why, for all its awfulness, COVID left the local economy relatively unscathed.
What’s Good For GM…
To return to the red giant metaphor, not only has the local economy recovered from its COVID-induced coma, but by all appearences is now growing at an explosive rate. The question is, at what cost?
In 1953, Charles Wilson, the then-president of General Motors, famously (although apocryphally) told Congress that “What’s good for GM is good for the country.”
By equating economic health with overall national health, Mr. Wilson encapsulated capitalism’s philosophical ideal of a successful society: Society thrives when every individual and organization maximizes their own economic self-interest.
Throughout its history, Jackson Hole has been home to folks who embrace this view. However, it’s also been home to many people who don’t, feeling instead the community should focus on the collective good, both human and environmental.
Tension has always existed between the two camps, but to date our geographic isolation and the relatively low demands on our natural and human resources have allowed for an uneasy truce. As money and people continue to pour into the region, though, that balance is failing. As a result, I think the next several years will be ones defined by increasingly pitched battles between economic self-maximizers and those who feel otherwise.
In fact, this battle is already heating up, as evidenced by the depth and breadth of concerns dominating locals’ conversations. Traffic. Housing. Real estate. Construction. Income inequality. Tourism. Crowds. Not only does the list goes on, but considering each item independently misses the unfortunate synergy between them.
A synergy so extreme that, as I noted earlier, even business owners are telling me that Jackson Hole is too busy this summer.
Which in turn raises the meta-question: Our economy may be booming, but who is benefiting from that boom? Surely some folks, but I’m not sure whom.
What I am sure of, though, is that our community is home to a large and growing contingent of anxious and worried and burned-out folks. Workers and shopkeepers and residents who share not just a passion for this place, but a sense that there is more to life – especially life in the Tetons – than simply working or, more broadly, catering to economic exigencies.
Something has to give, and I’m not sure what it will be. I fear, though, that the process will not be pretty.
Closing where I began, the great concern for us as a community is whether in its quest to grow – an effort abetted by entities ranging from international airlines and tourism companies to local websites and lifestyle magazines – Jackson Hole’s tourism economy has become like a red giant, an entity shining brightly because it is in the process of using up the community’s essential resources in a gloriously unsustainable fashion.
Our environment. Our people. Our sense of community. All of these essential resources and more are threatened by the seemingly insatiable needs of not just our tourism economy, but the related “Zoom town” economy which, in a bitterly ironic way, is sucking up many of the resources tourism needs to succeed.
A question I’ve heard repeatedly this summer is “Have we passed the point of no return?” Another is a variation on that theme: “Are we a community or just an economy? More than just an economy? Different than just an economy? Better than just an economy?”
Put more simply, are we as special as we think we are? Or are we notable only because tourists flock here, and because Wyoming’s tax laws have allowed us to become the richest county in the richest country in the history of the world?
By myself, I can’t answer these questions, nor address the issues they raise. I firmly believe, however, that collectively we can. As we consider our future, I know of no more important task.
Thank You for Your Support
Please support CoThrive, 22 in 21, and Charture’s many other efforts by making a donation through Old Bill’s Fun Run? Click here to go to the Charture-specific donation page.