Hello, and happy almost-Spring!
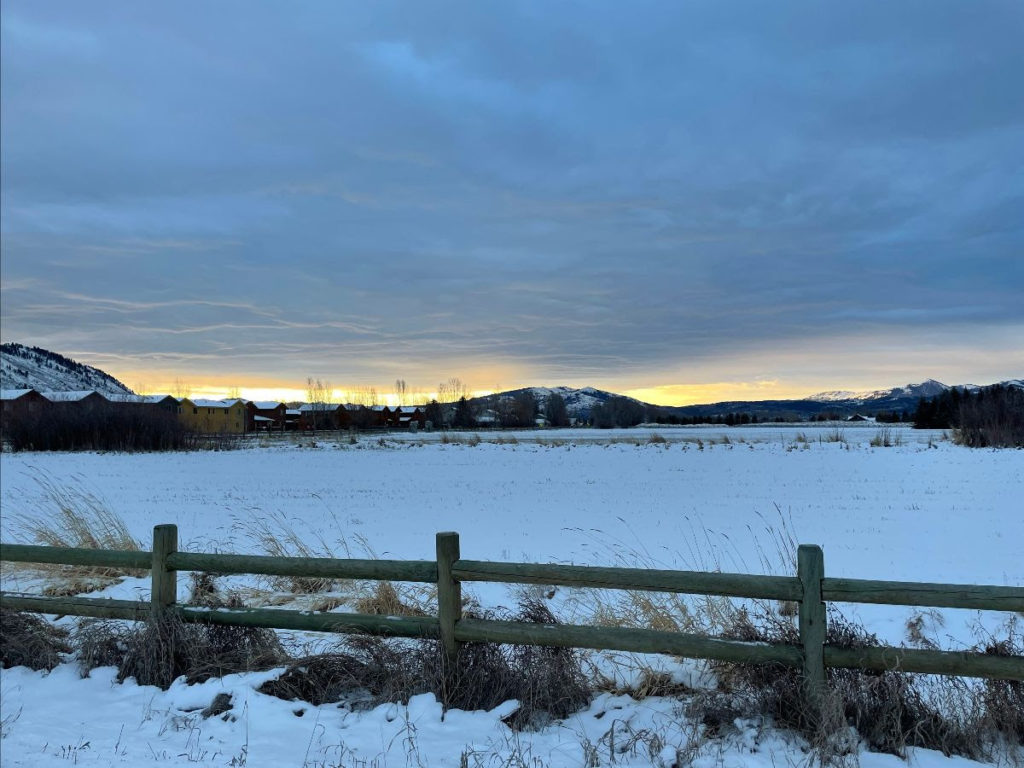
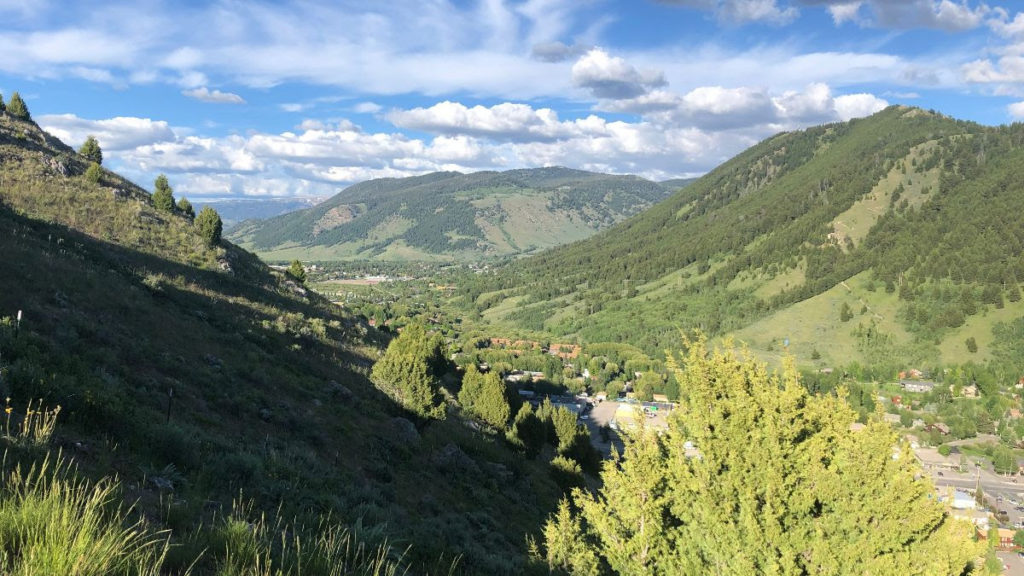
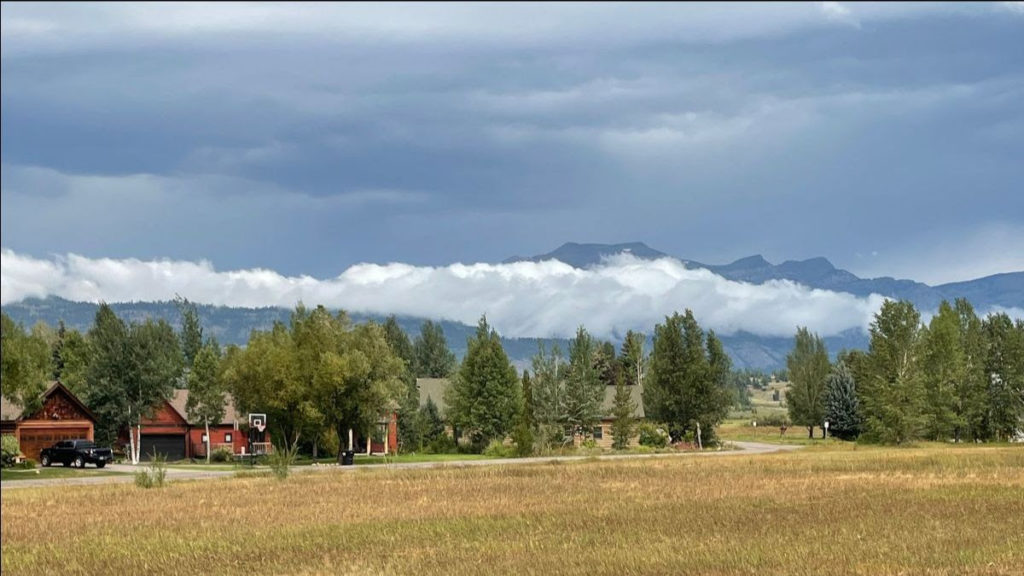
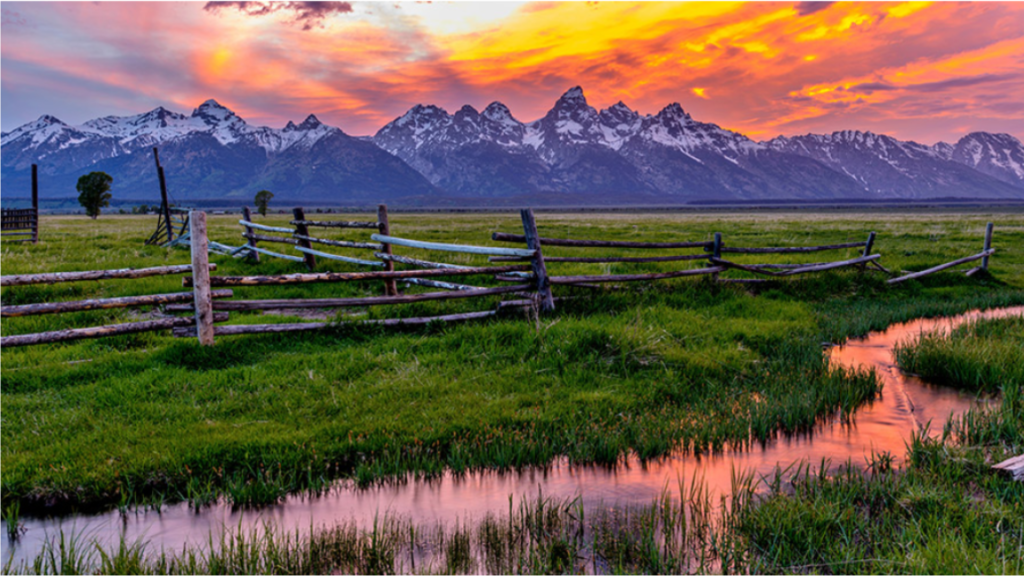
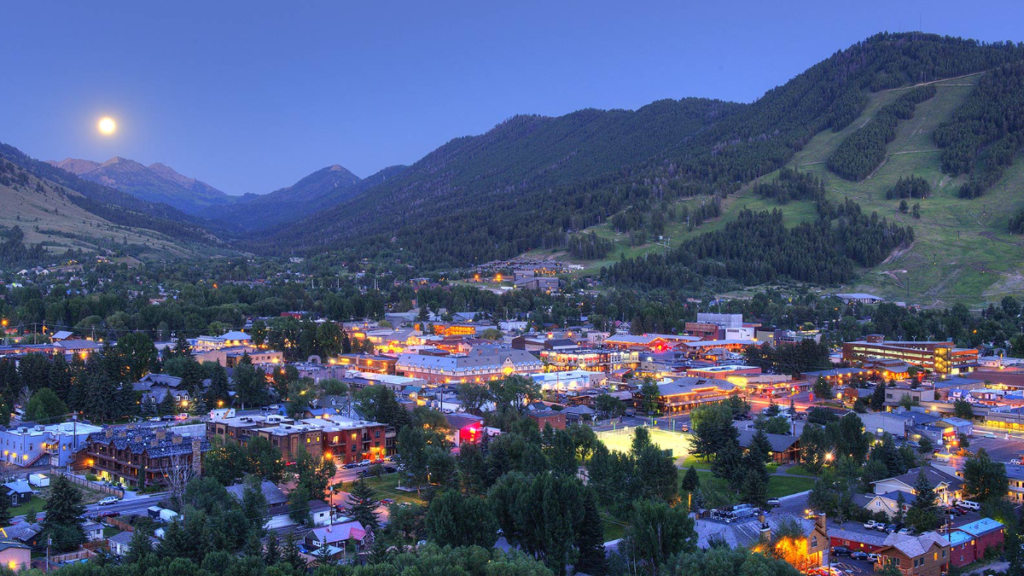
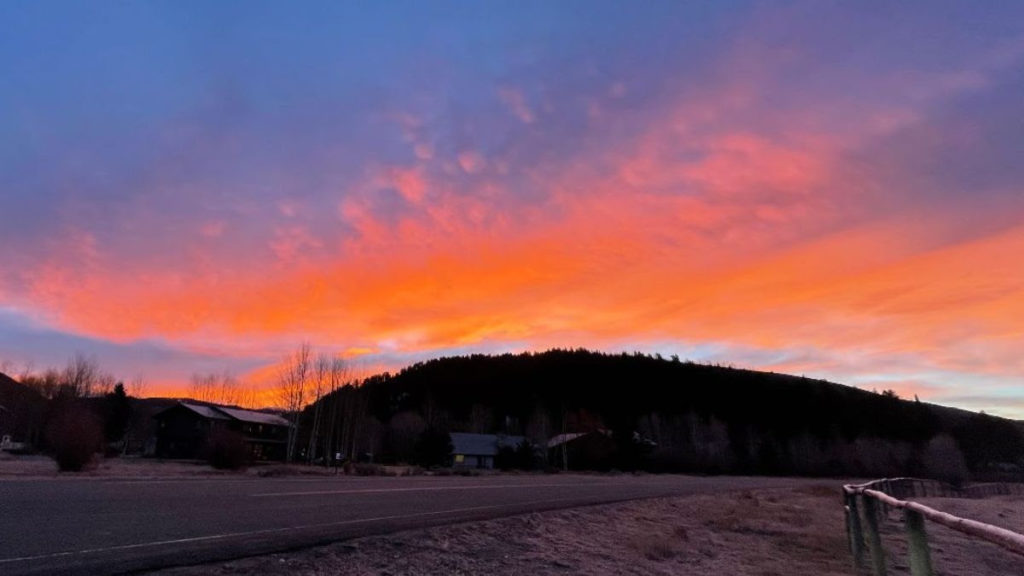
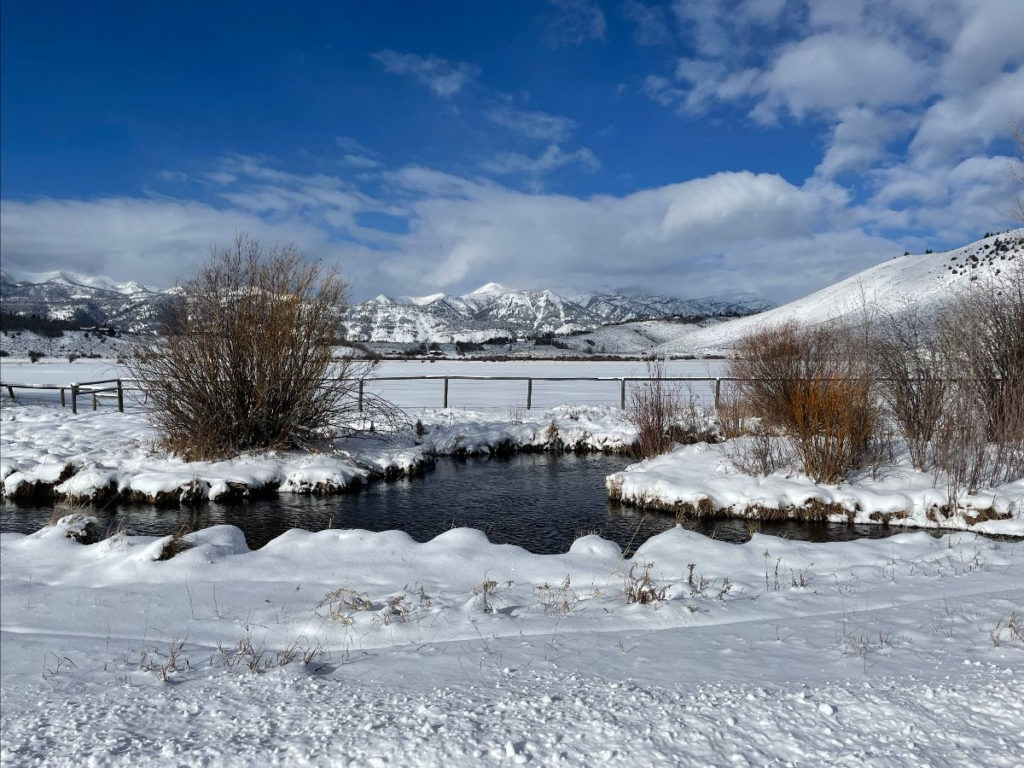
Earlier this week, Jackson Hole awoke to its first significant snowfall in what seems like forever. To my eye, the beauty was greatly enhanced by the wait.
In a similar spirit, since it’s been a while since I’ve published a newsletter, I’m hoping the wait will make this edition seem even more interesting…
Today’s focus is on three seemingly disparate items, linked by a temporal quality – what may or may not happen over the next many months:
- To Re-Run or Not to Re-Run
- Wildfire and Homeowner’s Insurance
- Gas Prices, Tourism, and Taxable Sales
Before diving in, one request. If you live in the Tetons region, will you please complete a survey exploring residents’ attitudes toward tourism? The deadline for completing the survey is Tuesday, April 5, 2022:
https://www.visitjacksonhole.com/locals
(Full disclosure: I heavily edited early drafts of the survey, and the final version reflects my contributions.)
As the days get longer, may your days become increasingly rich.
As always, thank you for your interest and support.
Cheers!

Jonathan Schechter
Executive Director
To Re-Run or Not to Re-Run
Budgets are the clearest indicator of an organization’s priorities. From that perspective, many years ago I found it curious that, despite having a Comp Plan whose Vision Statement so powerfully embraces ecosystem stewardship – “Preserve and protect the area’s ecosystem in order to ensure a healthy environment, community and economy for current and future generations” – neither the Town of Jackson nor Teton County were putting much money into pursuing their vision.
When I took office, this realization morphed into a goal for me to pursue; a polestar of sorts to guide my efforts whenever the job threatened to knock me off course. Happily, in the town’s FY 2022 budget my colleagues and I approved a unique-in-the-nation Ecosystem Stewardship Administrator job, and it will soon be filled.
I mention this because my town council seat is up in November, and I’m in the throes of deciding whether to run for re-election. On the positive side, there are many aspects of the job I really enjoy, and I think I’ve grown to become a pretty good local elected official. On the negative side, to be done properly the job requires far more time than the salary suggests, and its inherently chaotic nature can be exceptionally grinding, especially to a fundamentally introverted person like me.
Given this, at the moment I’m thinking my decision will be guided by answers to two fundamental questions.
First, can I find a new polestar? I lucked into championing the Ecosystem Stewardship position, and pursuing that goal served me very well these past few years. Now that the position exists, though, I need to find something else. Going forward, what might replace it?
Second, given my interests – including my vision for what Jackson Hole can be – how can I best pursue the things I want to do? Is the best use of my time being in elected office, or doing something else?
I mention all this because it in part explains why I’ve not published a newsletter in a couple of months. As part of my effort to answer my fundamental questions, I have been researching and writing a paper in which I try to understand the breadth and depth of the many challenges – and, critically, the many opportunities – facing the greater Jackson Hole region and, by extension, our nation and world.
What I originally envisioned as a modest exercise has now consumed a couple of months, and currently features a far-from-finished 60 page manuscript. Whether the paper ever sees the light of day isn’t clear to me. What is clear, though, is that if I do run again, playing an important role in that decision will have been the process of deeply considering where my community is, how its parts work together, and how we might be able to use our many environmental, social, and economic riches to make a meaningful difference in the world.
What do you think? I welcome any thoughts about whether I should run again (well, maybe not the snarky ones, but…).
Wildfire and Homeowner’s Insurance
At the end of December, a wildfire raced across Boulder County, Colorado. Nearly 1,100 homes were lost, and another 150 or so were partially burned. Total damages were estimated at over $500 million, an average of roughly $500,000 per home.
Making a bad situation even worse, many who lost their homes discovered their insurance wouldn’t cover the entire cost to rebuild. In many cases, their insurance didn’t even come close to making them whole.
That got me thinking – not just about my own personal situation, but about my community. Given the drought conditions throughout the west, and given that February marked a near-record low in local snowfall, my concern was that if a wildfire sweeps through Jackson Hole, many of my friends, neighbors, and constituents could find themselves in the same, awful boat as the folks in Boulder County; i.e., not only having lost their home, but finding out they were under-insured.
When I checked, I found out that I could have been one of those unlucky souls. In particular, my insurance company told me that under my policy, I would receive $225/square foot if I needed to rebuild my house. That struck me as low, but they assured me that this is what their computer model said were the costs for my area.
Curious, I talked to friends in the building trades. They said that, given supply shortages and Jackson Hole’s current building frenzy, the current actual cost of building a home like mine is more like $600/square foot.
Eventually I got things straightened out with my insurance company, but not before I found out that:
- they were using one construction cost figure for all of Wyoming; and
- their “one figure fits all” was based on building costs in Rock Springs, Wyoming, where the median home price is roughly one-tenth of that in Jackson Hole.
What about others in my community? Concerned, I wrote Wyoming’s Insurance Commissioner Jeff Rude, asking what steps his office could take to ensure that homeowners across the state knew whether they were adequately insured. I then followed up by meeting directly with Commissioner Rude and his team.
The upshot is that Wyoming’s Department of Insurance is looking into what it can do, both legally and in terms of getting information out to the state’s residents. Locally, I’ve shared the letter with the local media, in hopes they’ll find the story sufficiently interesting to write a story or two about the situation.
Finally, I’m using this newsletter to urge you to check your insurance. Please see whether you have the insurance level you want in case the type of nightmare that befell Boulder County should strike your neighborhood. Sadly, as our climate warms and the west becomes drier, that possibility becomes increasingly likely.
Gas Prices, Tourism, and Taxable Sales
All of Wyoming’s governmental agencies operate on a July 1 fiscal year. As a result, both the Town of Jackson and Teton County are in the early stages of crafting their respective budgets for Fiscal Year 2023.
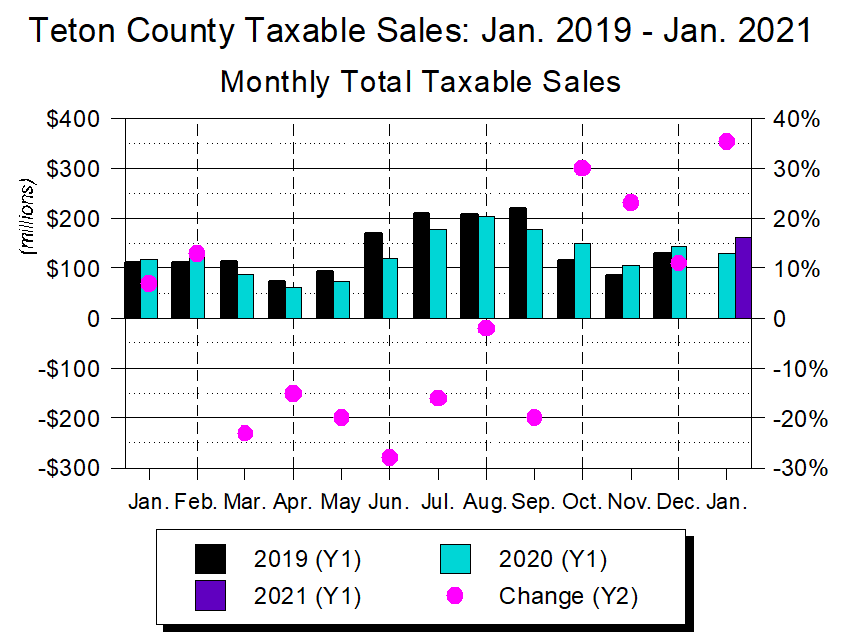
Key to this effort is estimating how much revenue each body can expect to generate. And key to that is estimating the coming year’s taxable sales, because both the town and county are exceptionally dependent on sales taxes for their revenues.
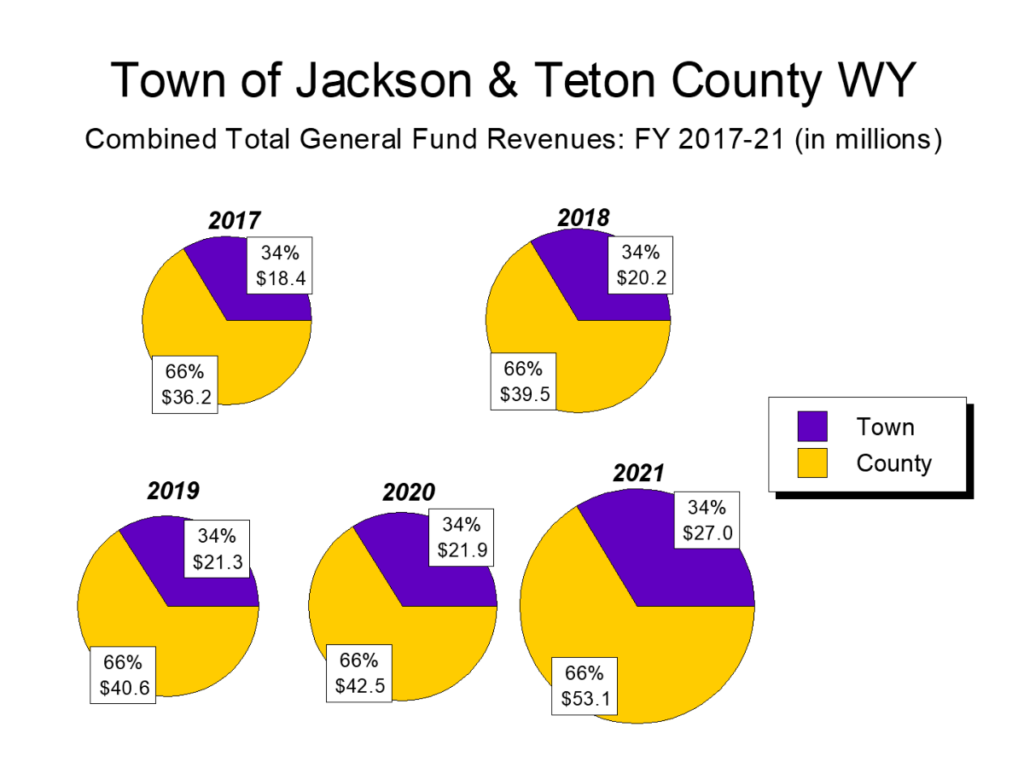
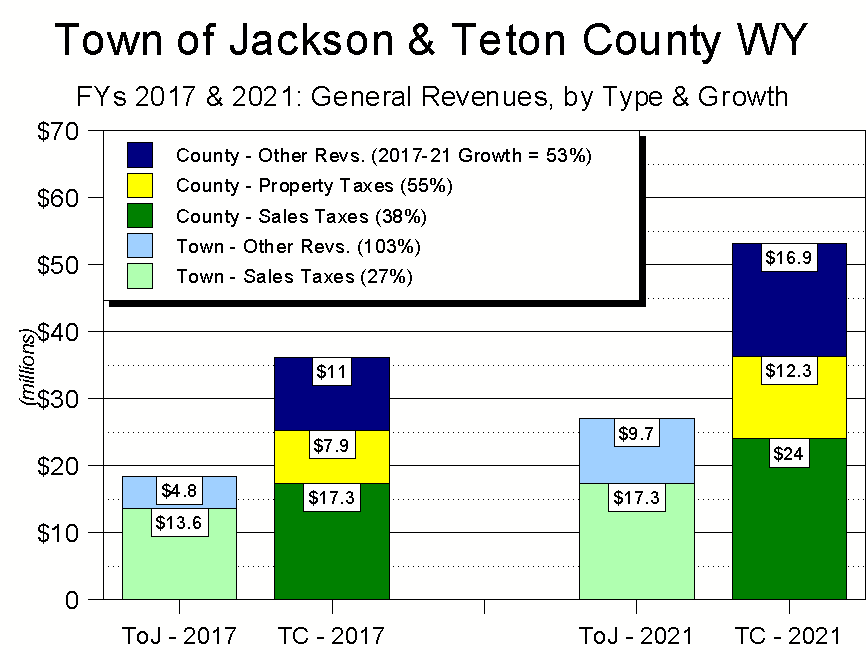
In Jackson Hole, the county government’s annual general revenues are twice those of the town’s. But because sales taxes account for over half the bodies’ combined general revenue funding, local government’s financial well-being is closely linked to how much taxable stuff residents and tourists buy.
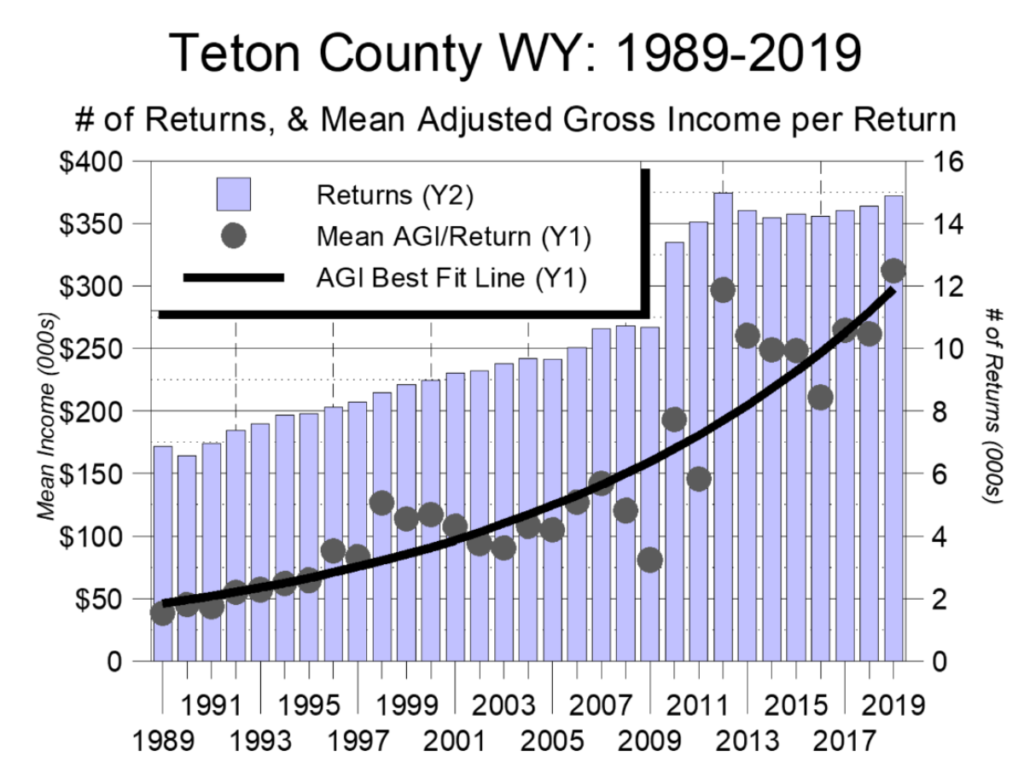
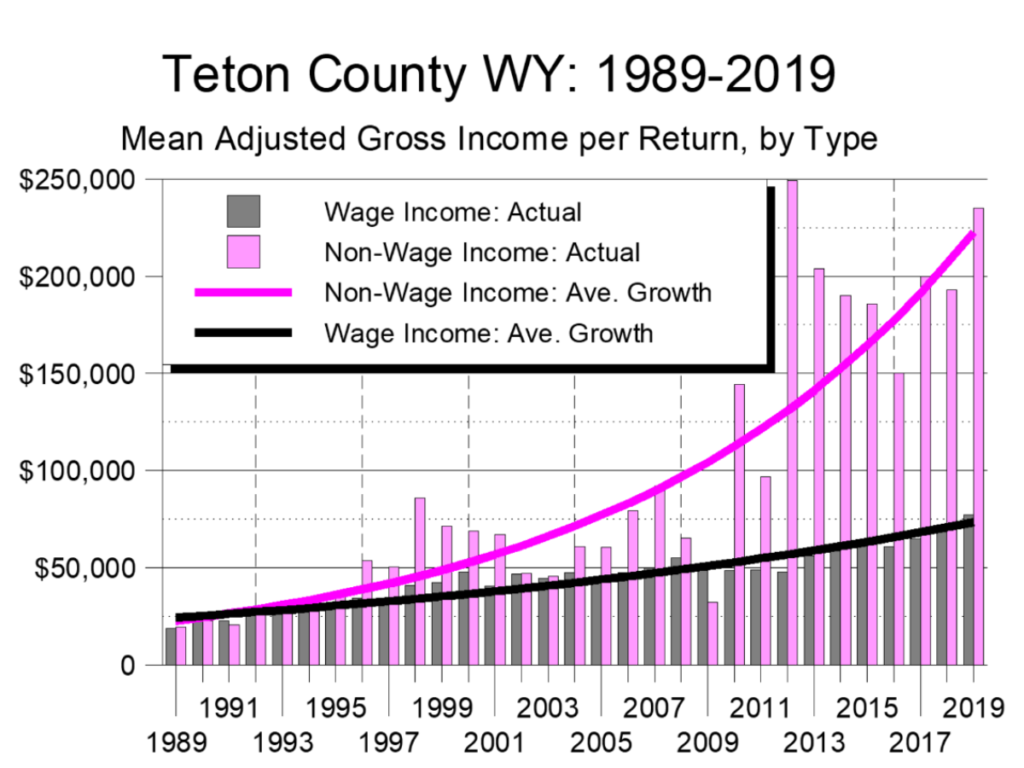
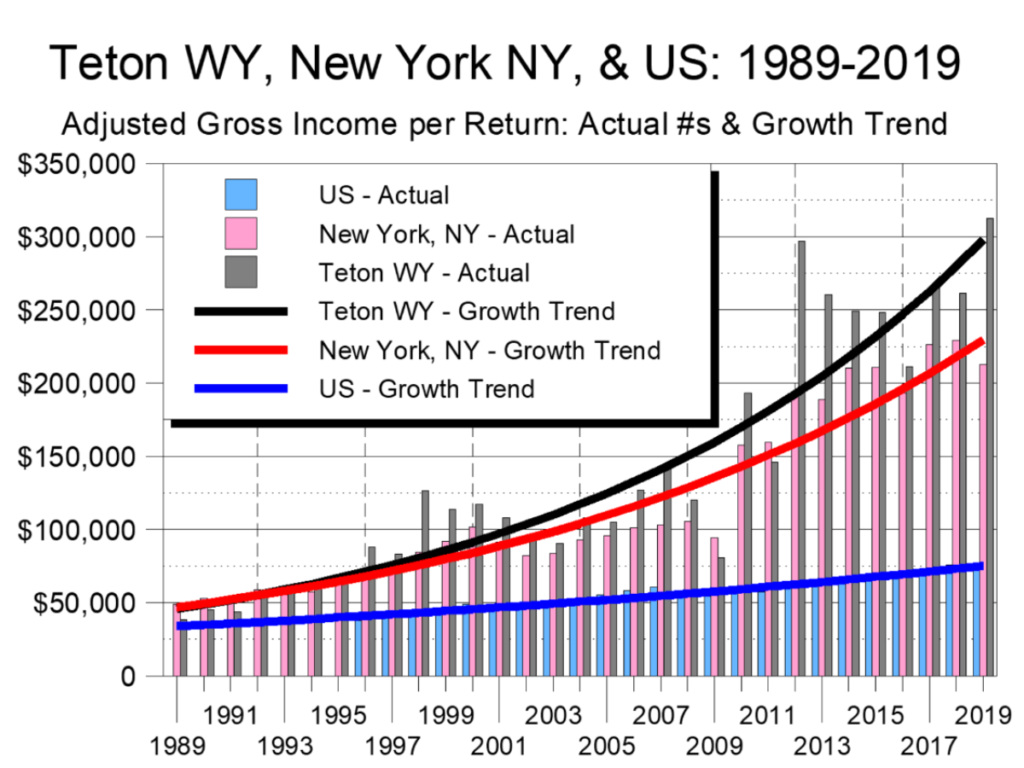
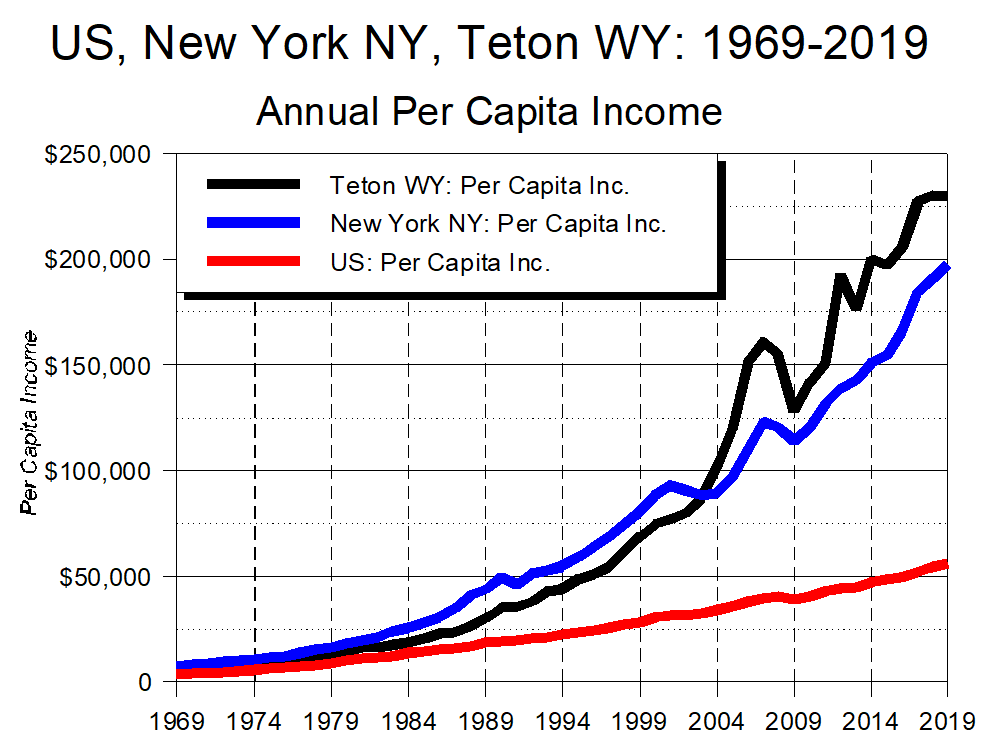
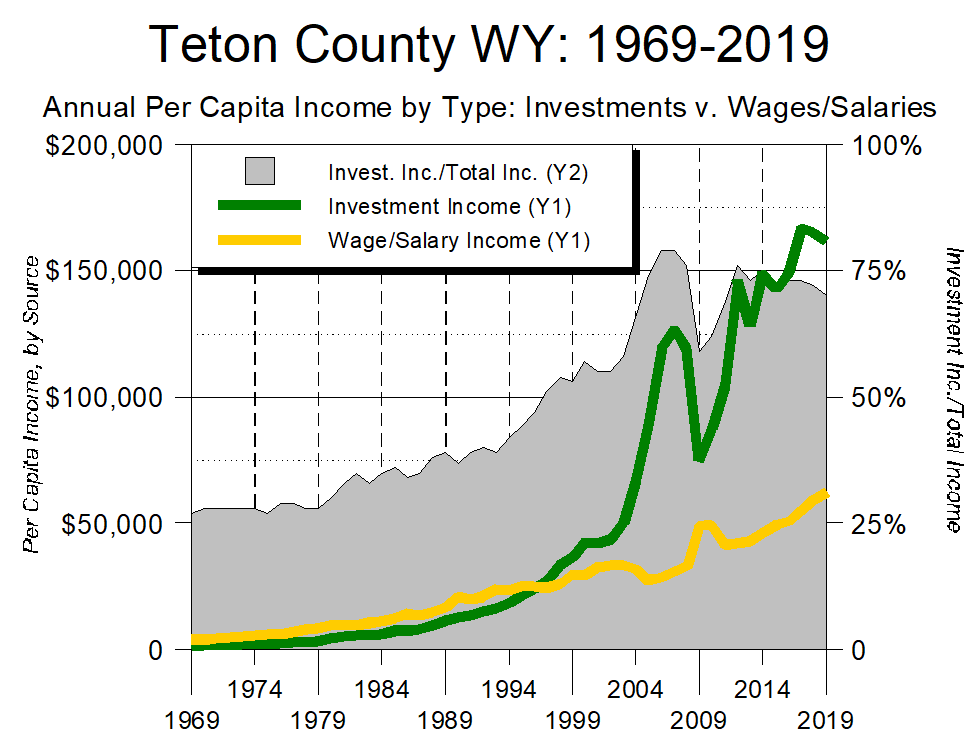
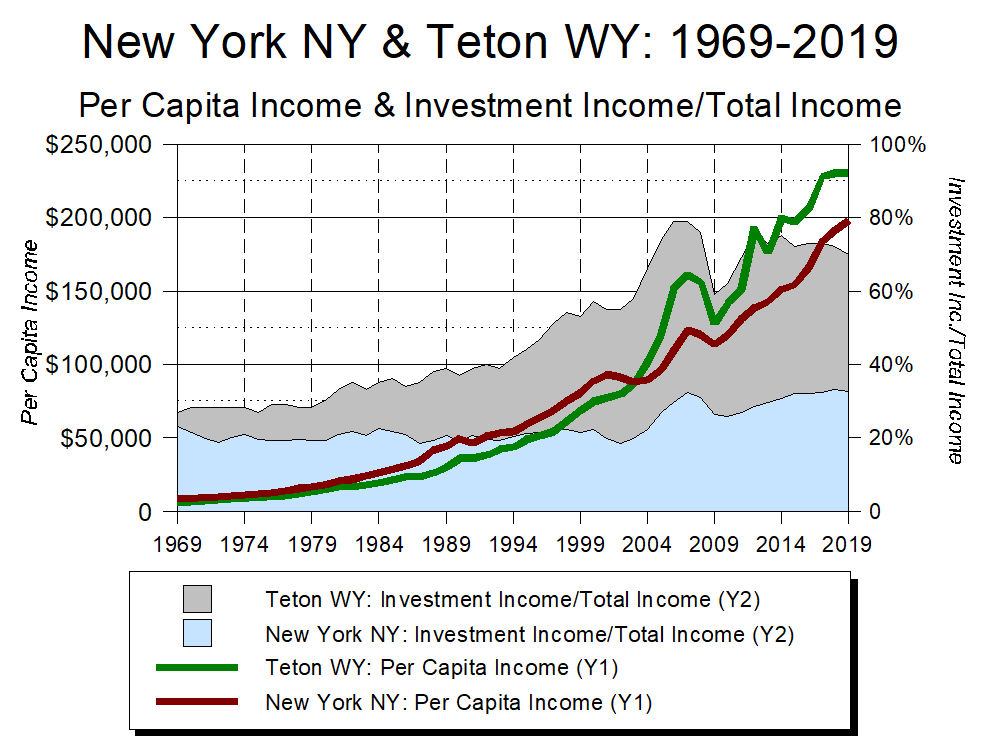
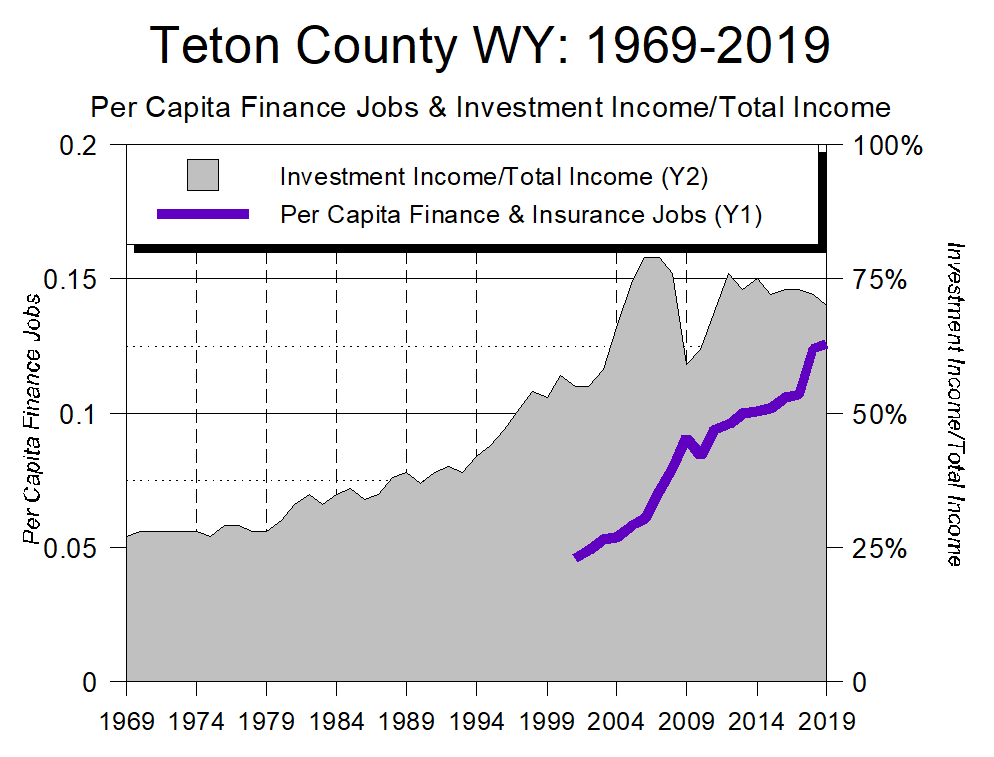
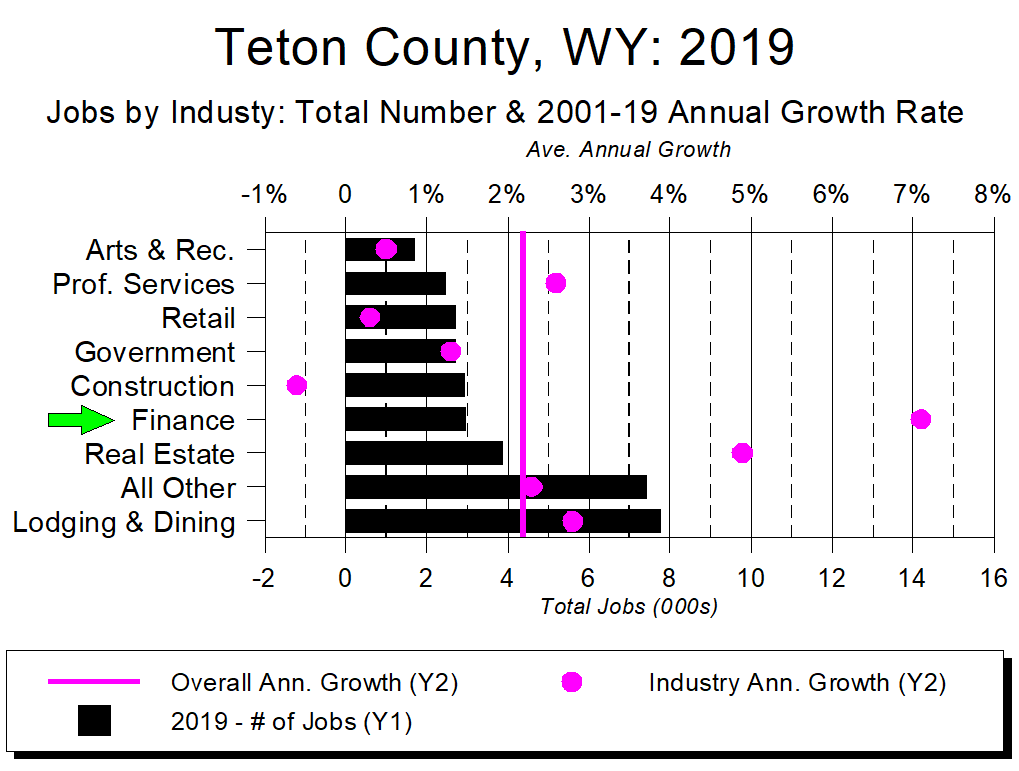
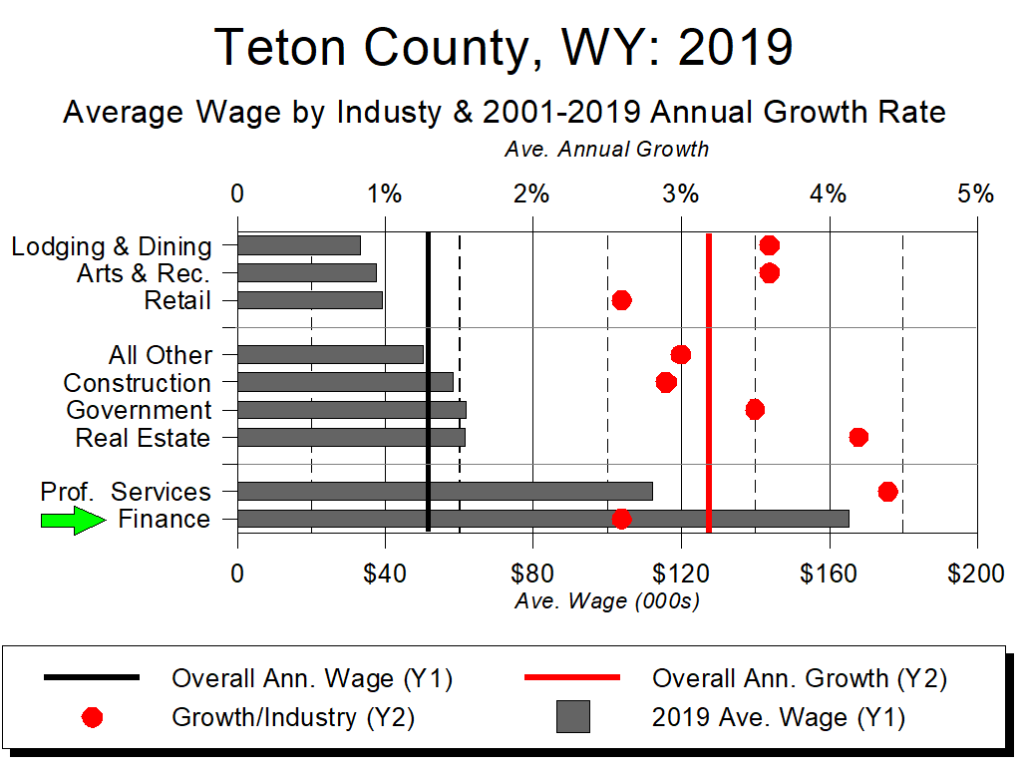
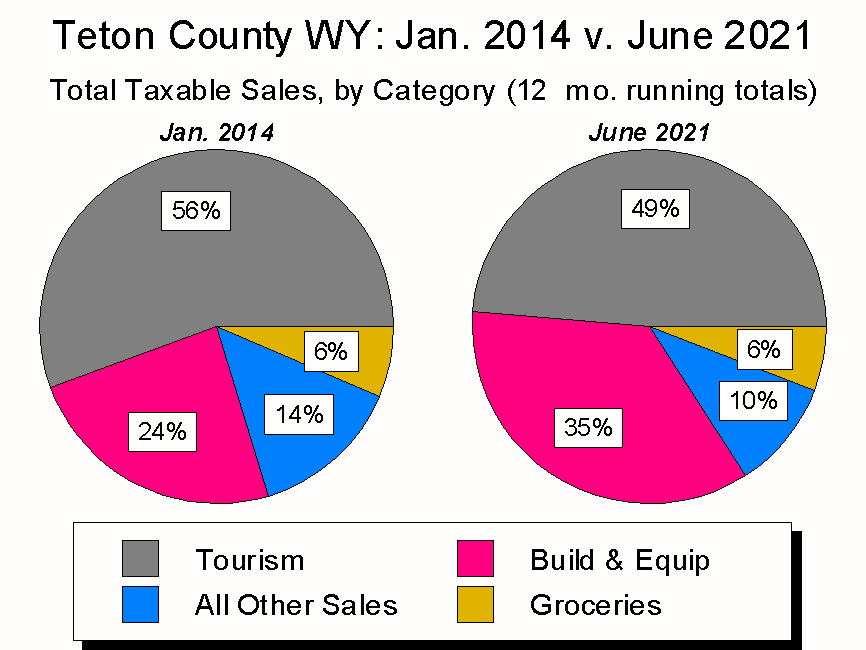
Over the past century, Jackson Hole’s economy has evolved from one emphasizing ranching to one emphasizing tourism to, today, one in which residents’ incomes increasingly come from location-neutral sources such as investments and professional services salaries.
Unfortunately, under Wyoming law these location-neutral economic activities generate no revenue for local government, and what’s not evolving is how local government is funded – as has been the case for over half a century, tourists still provide a significant chunk of those critical sales tax dollars.
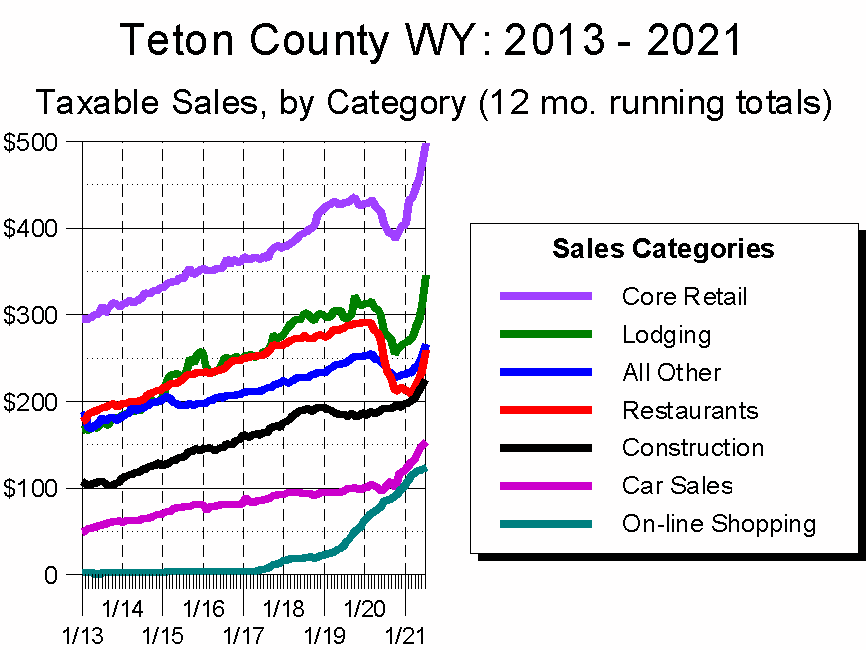
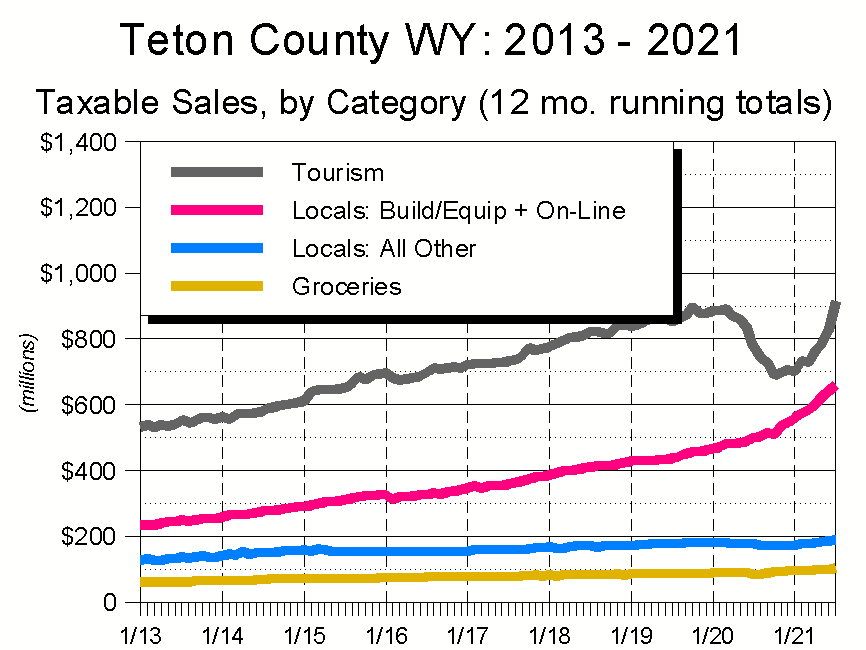
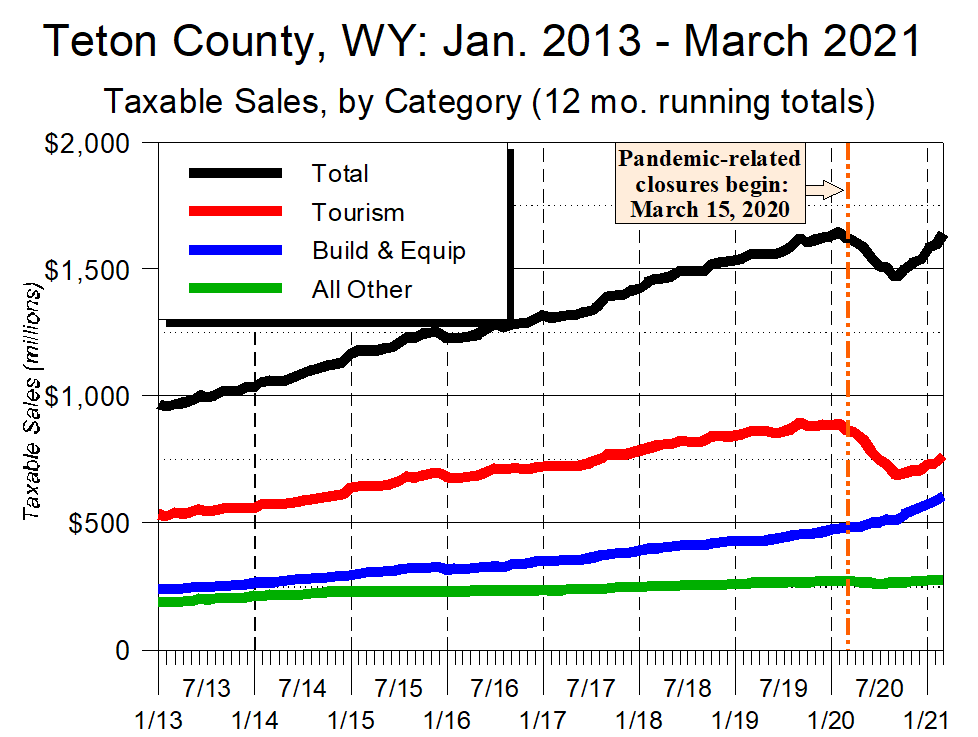
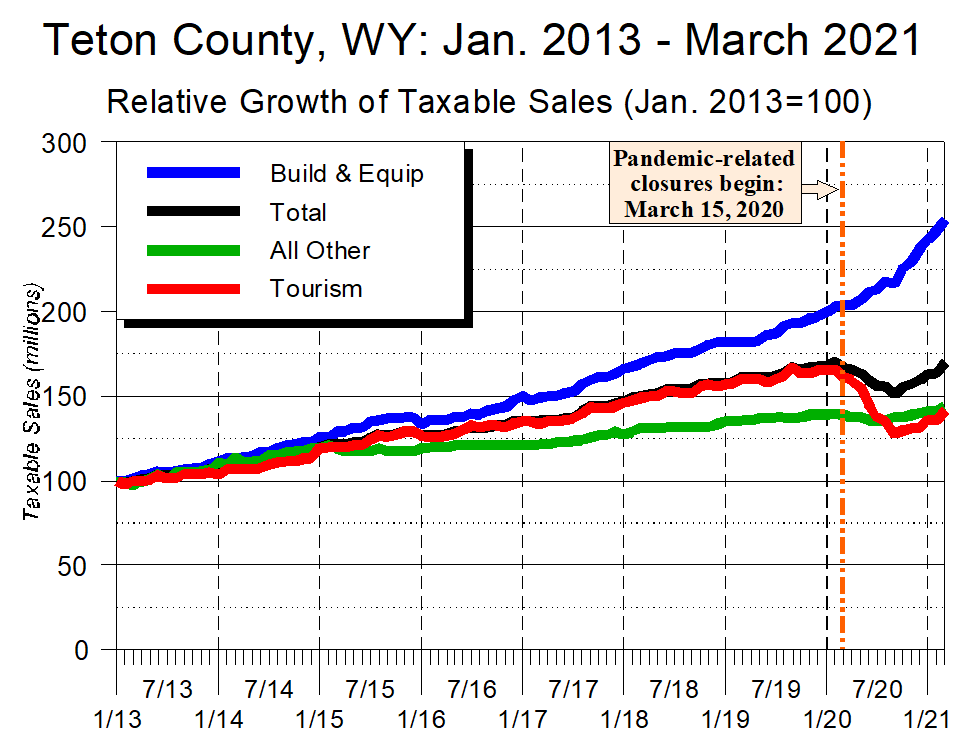
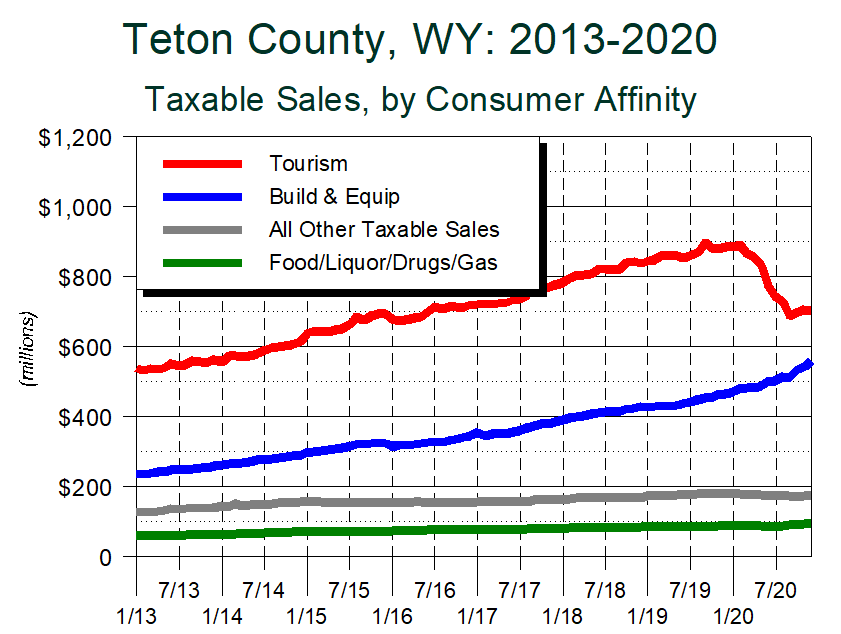
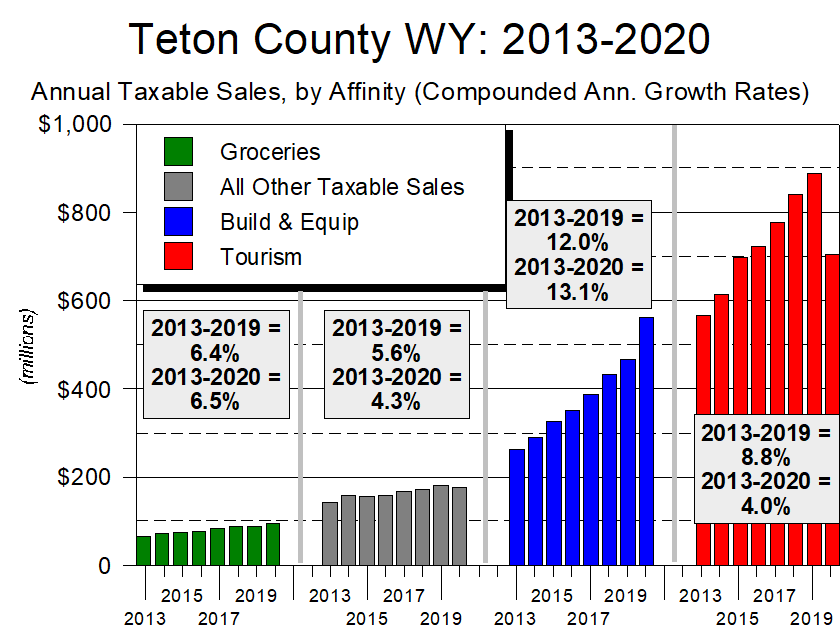
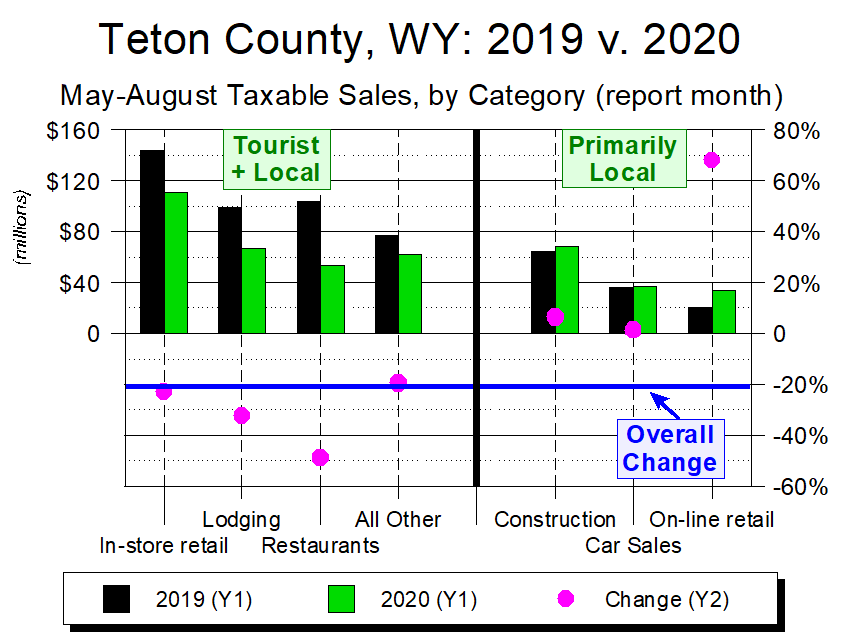
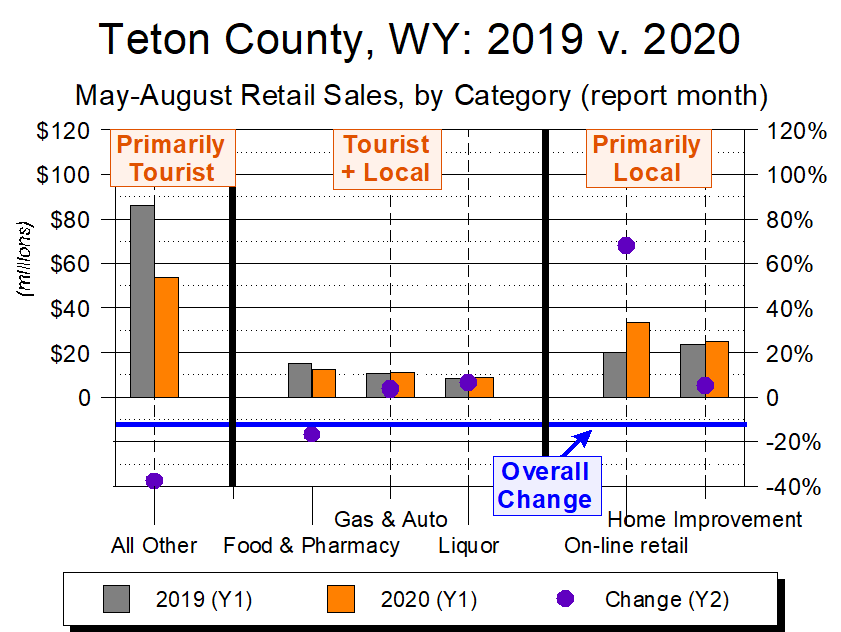
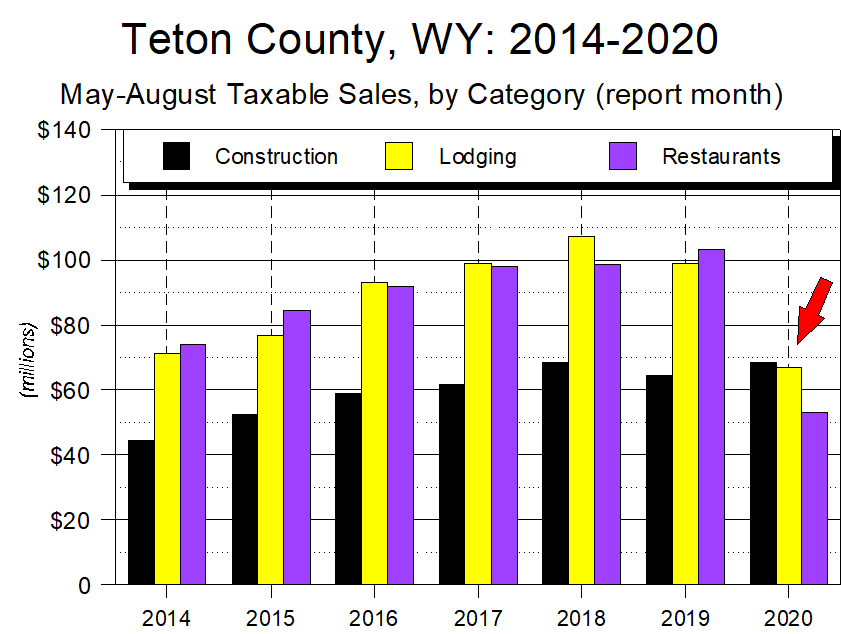
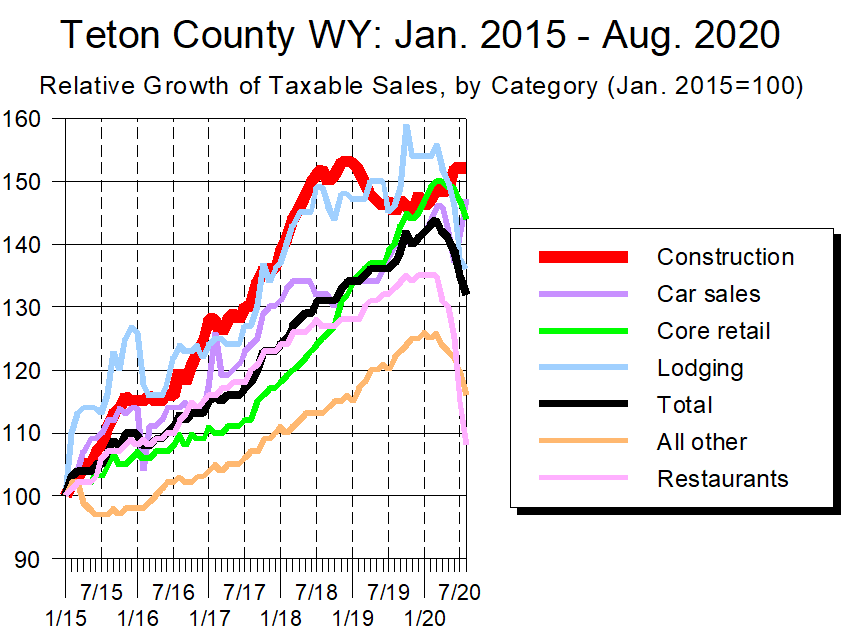
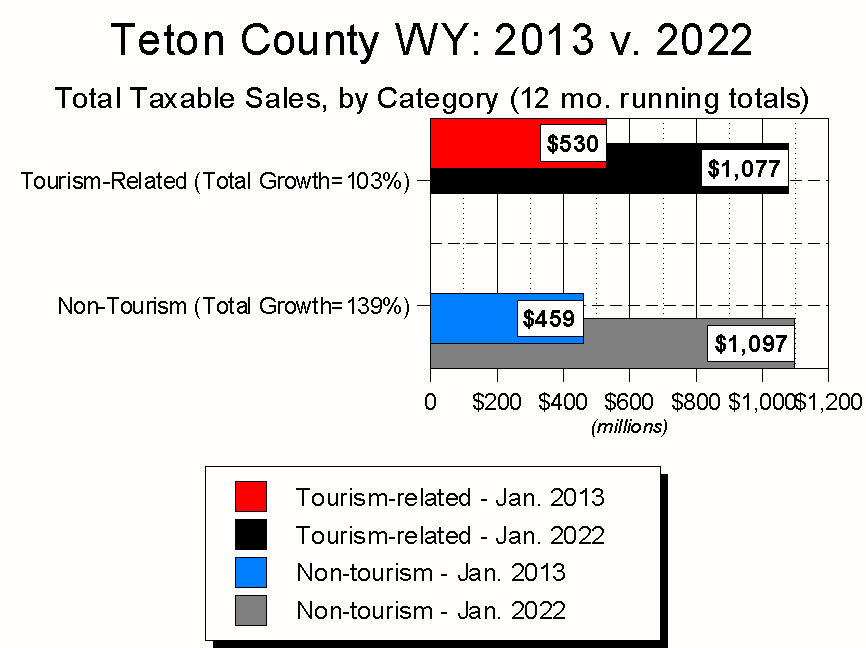
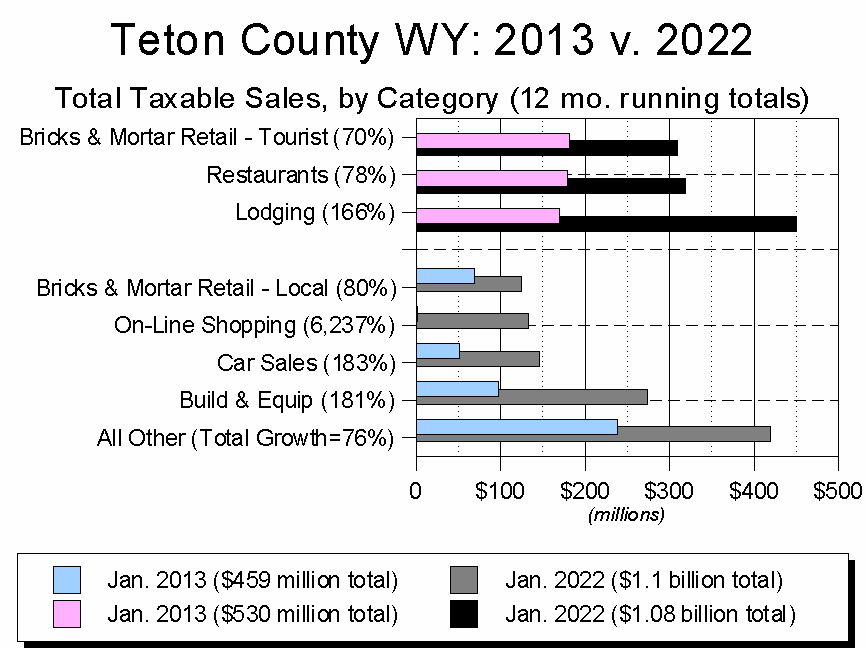
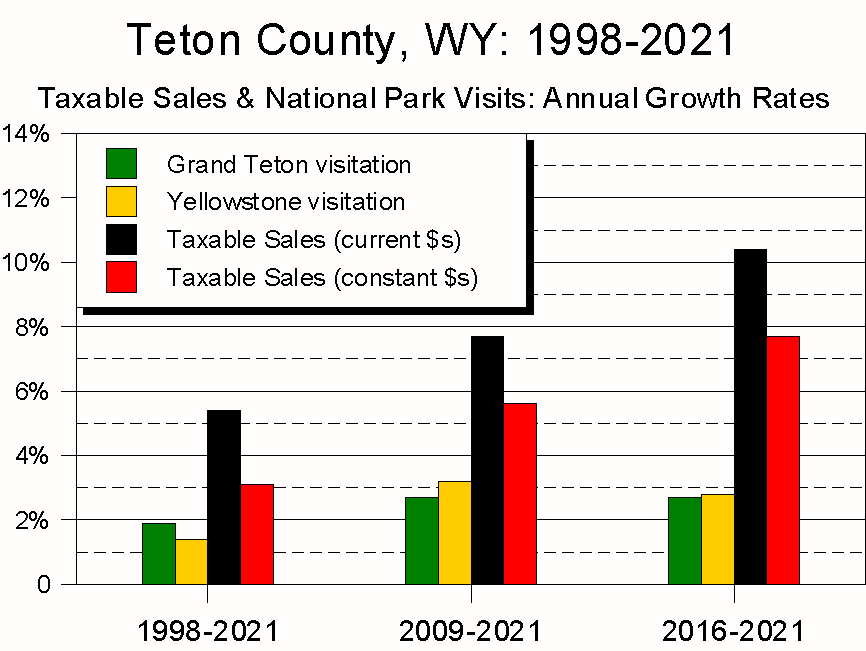
But not as big a chunk. Since 2013, sales taxes generated by businesses associated with Teton County’s tourism-related industries have grown more slowly than those associated with industries not directly associated with tourism. In particular, the three taxable sales categories with the highest growth rates – on-line shopping, car sales, and the building and equipping of homes – are, at best, tangentially related to the region’s tourism economy.
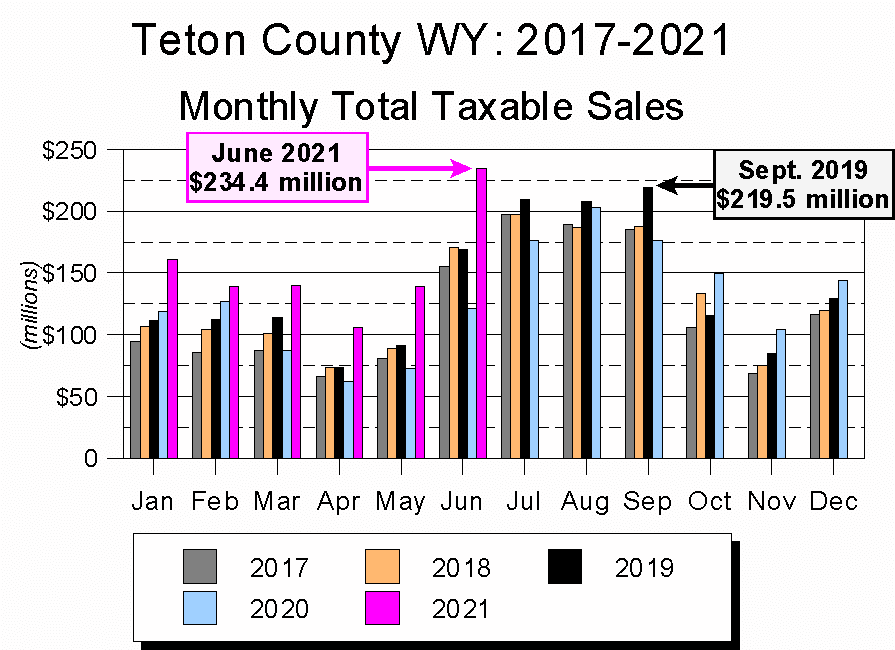
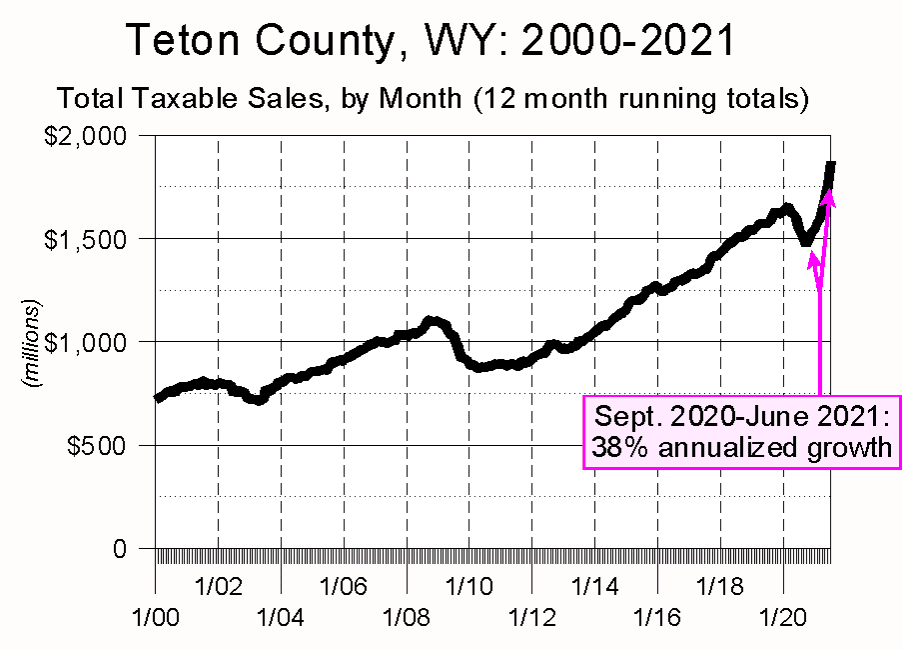
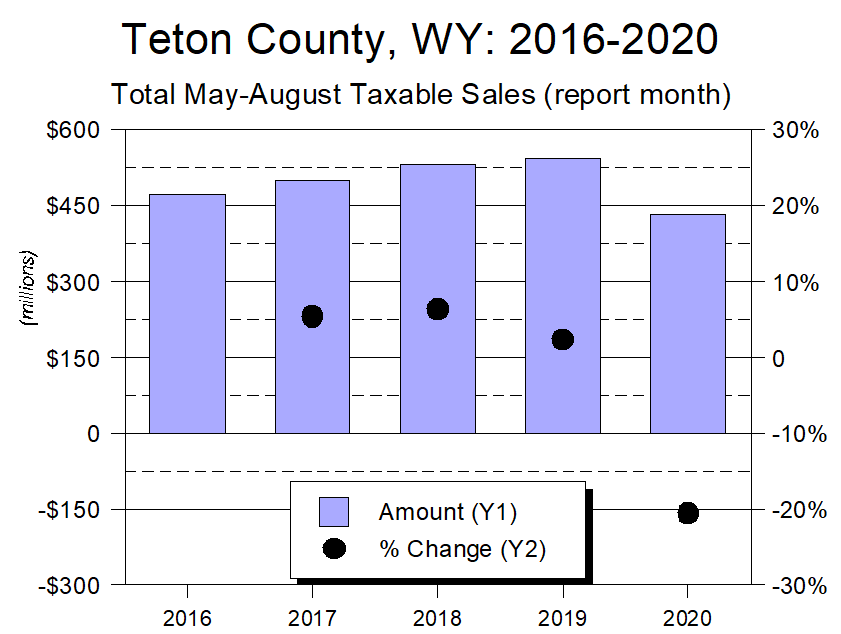
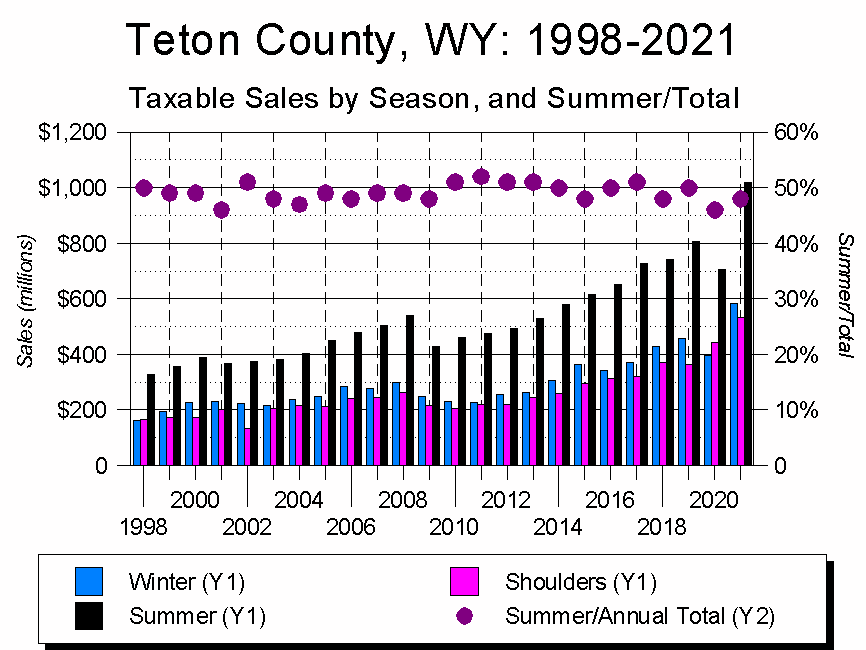
For reasons ranging from individual livelihoods to community character, though, tourism remains vital to Jackson Hole. This raises the question of how the recent spike in gas prices might affect the critical summer tourism season (for all of Jackson Hole’s fame as a ski area, ~50% of each year’s taxable sales occur in the four summer months of June-September).
To explore this question, I looked at four data sets:
- Annual average US gasoline price/gallon
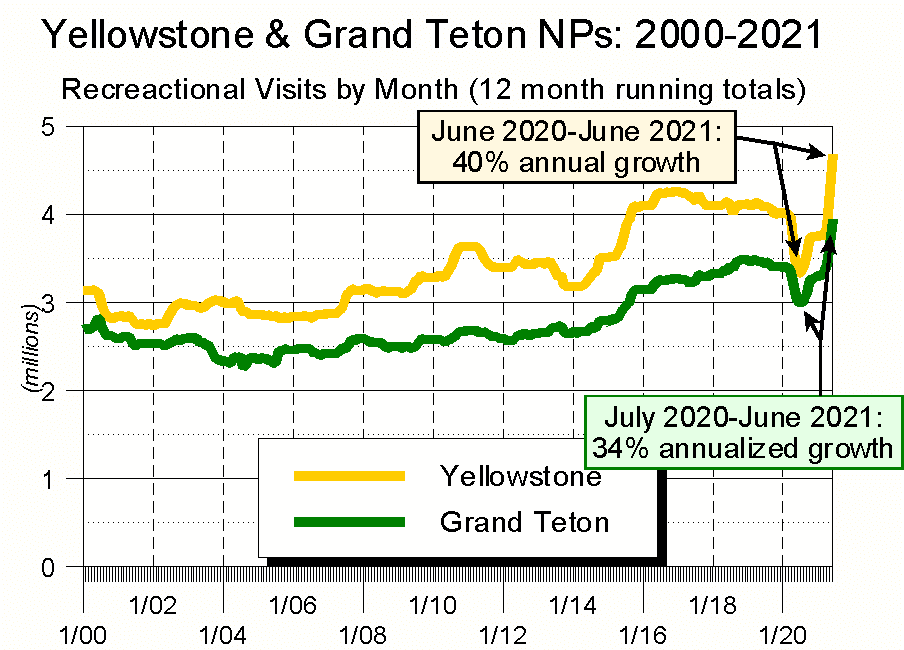
- Annual recreational visits to Grand Teton National Park
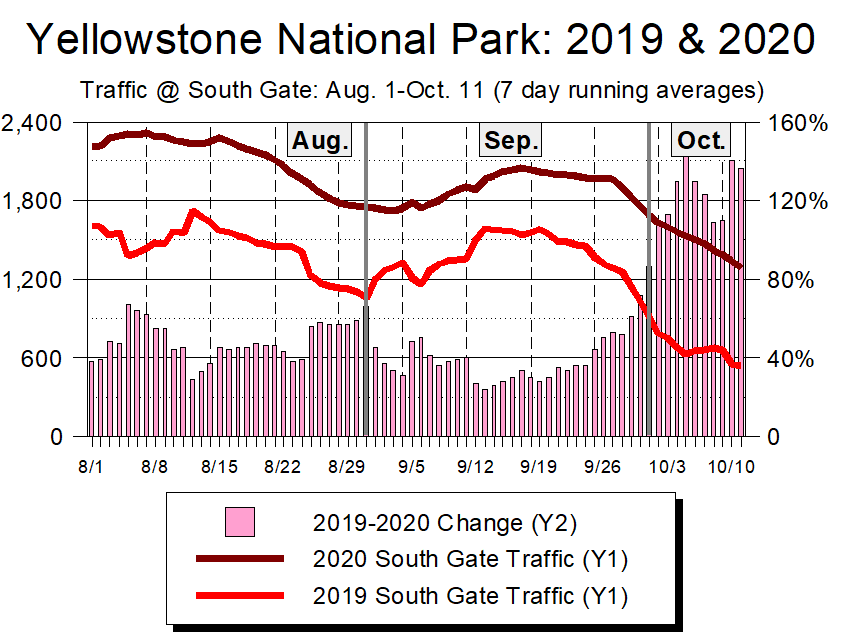
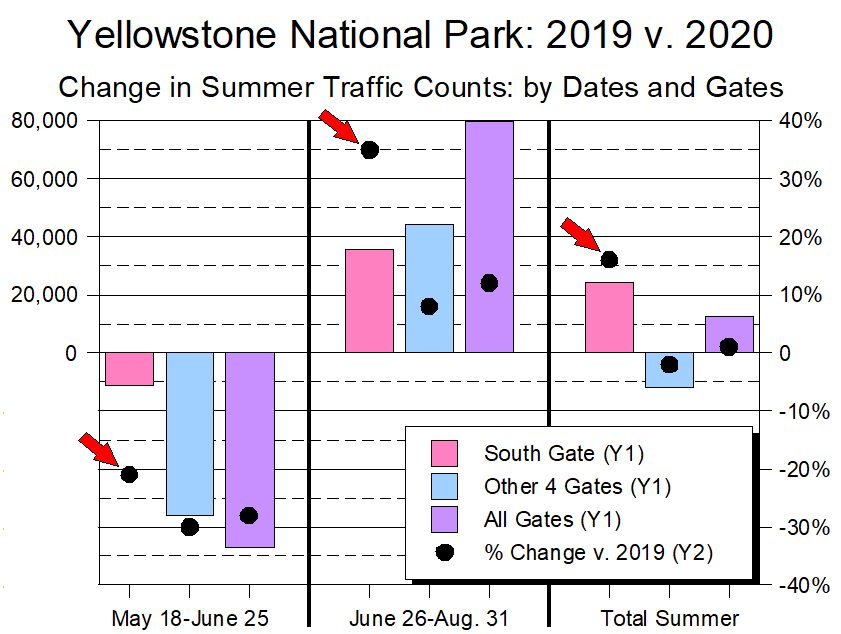
- Annual recreational visits to Yellowstone National Park
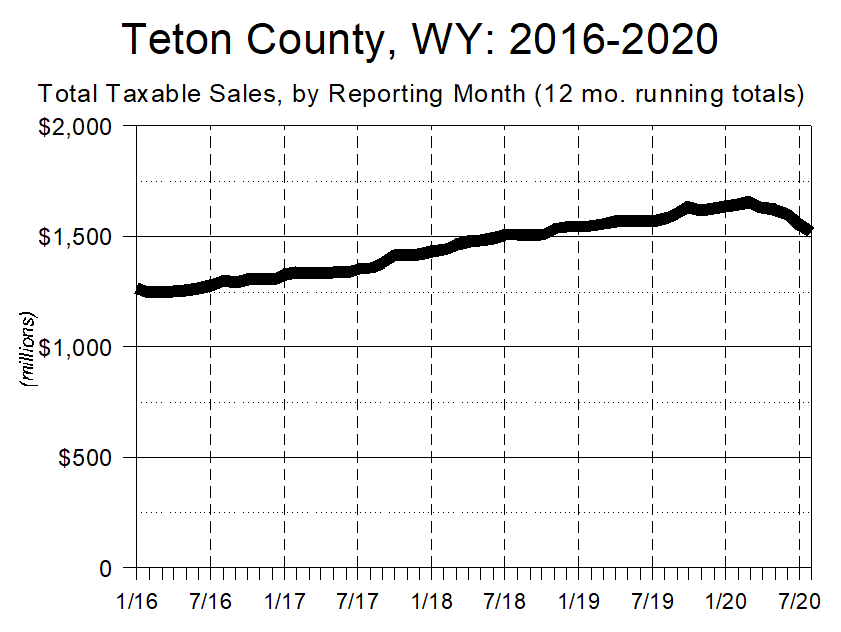
- Annual taxable sales for Teton County, Wyoming
For the first three, data were available from 1993-2021; for sales taxes, they were available starting in 1998.
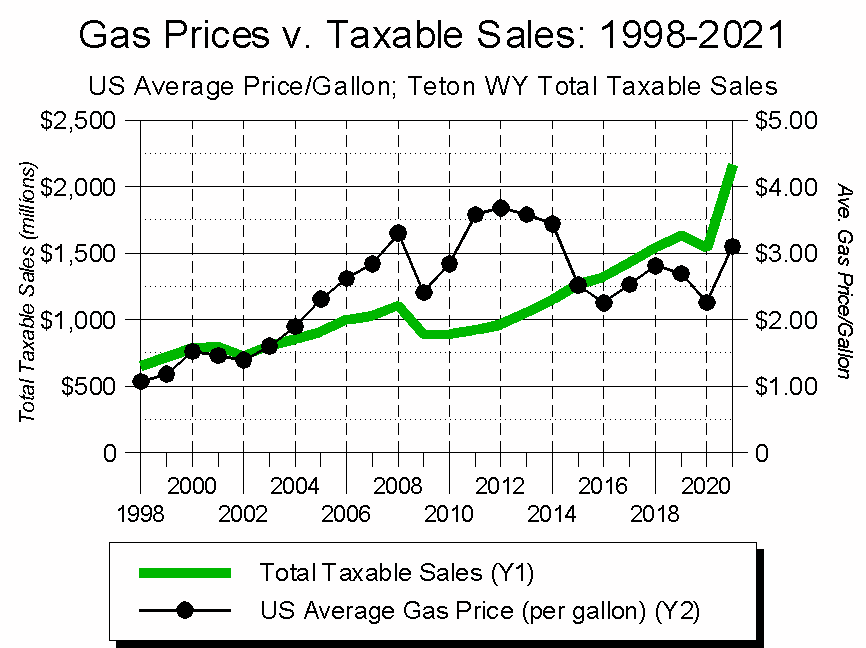
The first graph below compares gas prices to national park visitation; the second compares gas prices to taxable sales.Whether you just look at the graphs or conduct a statistical analysis, the conclusion is the same: there is no statistically significant correlation between gas prices and local national park visitation or taxable sales.
(For data wonks, the R-squared value for gas prices and Grand Teton visitation is 0.05; for gas prices and Yellowstone visitation it’s 0.27; and for gas prices and taxable sales it’s 0.35. For non-data folks, R-squared is a measure of how closely two data sets are correlated. Values range from 0 to 1, and 0 means there’s no correlation at all, while 1 means there’s perfect correlation. As a point of reference, the closely-linked Yellowstone and Grand Teton visitation figures have an R-squared value of 0.86.)
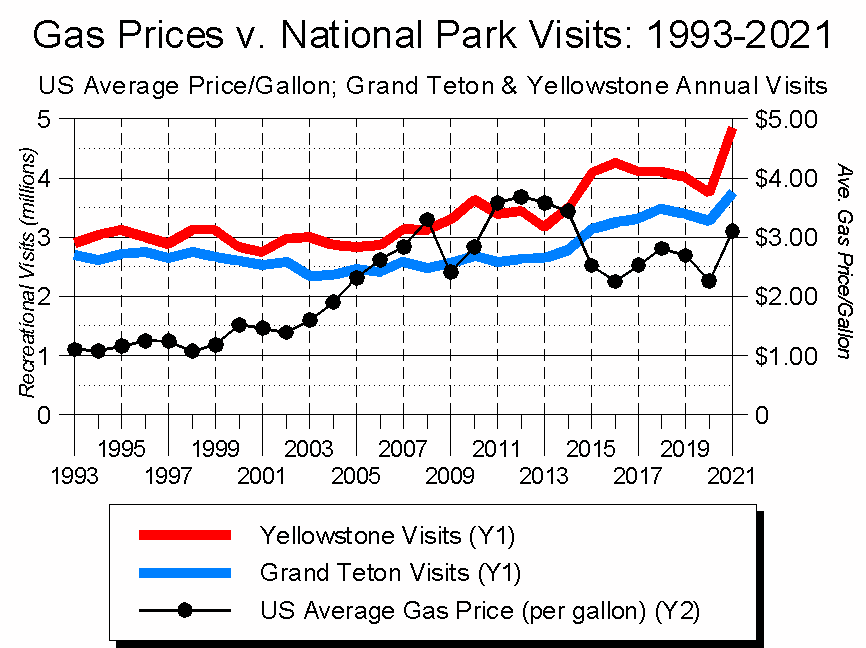
A much stronger correlation exists between national park visitation and taxable sales. Stronger, but not perfect: the R-squared value between Yellowstone visits and Teton County taxable sales is 0.76; for Grand Teton it’s 0.79. This suggests that summer tourism is a decent, but far-from-perfect, indicator of what will happen with the community’s taxable sales. Gasoline prices are not.
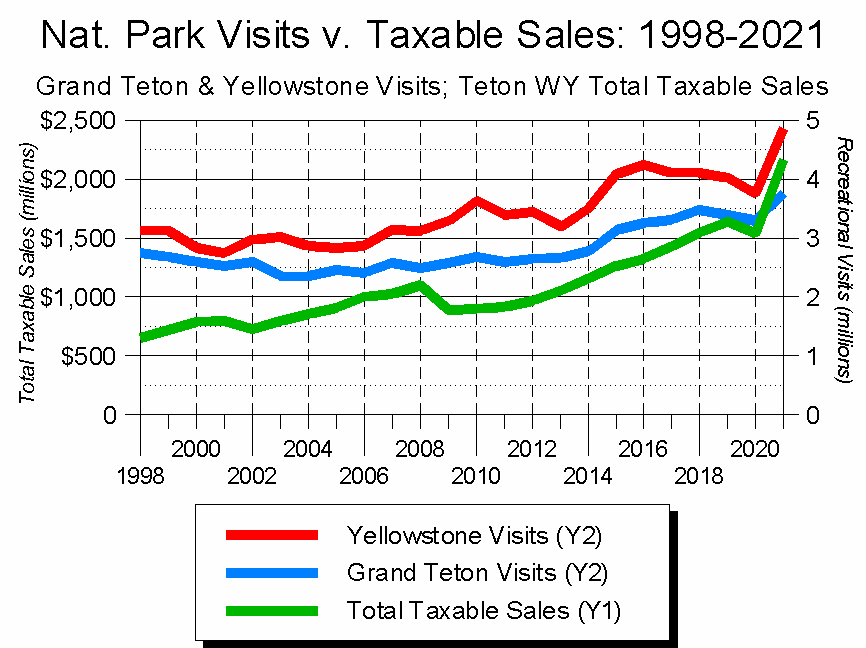
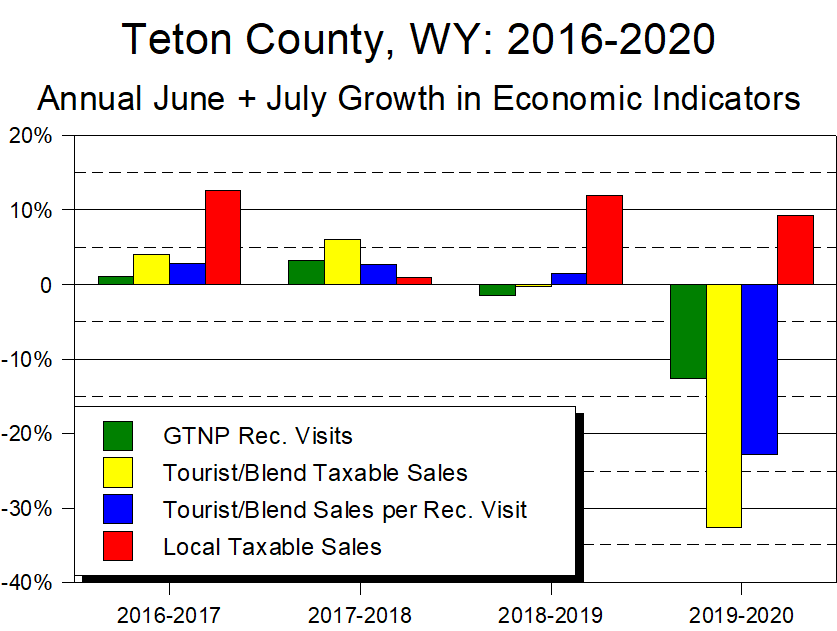
Notably, as Jackson Hole’s economy has become increasingly driven by location-neutral income sources, the connection between national park visits and taxable sales has grown weaker.
What to make of all this? Two things catch my eye.
First, if you want to predict how many people will be visiting Jackson Hole this summer, ignore gas prices. However much intuitive sense the connection makes, there’s no factual evidence that gas prices affect local summer tourism – whether visitation numbers or taxable sales.
Second, despite the community’s ski culture, historically the four generally-overlooked shoulder months of April, May, October, and November generate nearly as much taxable sales as do the four heavily-hyped winter months of December-March. Here, too, it makes no intuitive sense, but 20+ years of data make a pretty compelling argument.