Hello,
Welcome to the June 25, 2020 edition of the CoThrive newsletter.
First things first. Today’s my son’s birthday. He’s the apple of my eye, the spring in my step, the light of my life. He’s also 32, which is inconceivable (especially given that I feel no more mature today than I did the day he was born). I’m also confident that no father can bestow upon his son a greater birthday gift than a blog post discussing tourist visits to Yellowstone and Jackson Hole’s taxable sales – the happiest of birthdays, Alex.
The previous edition of CoThrive was published five days ago (click here to read it). In it, I looked at the first four week’s of this summer’s visitation to Yellowstone, and found that, for several days in mid-June, traffic counts through the South Gate (i.e., coming into Yellowstone from Jackson Hole) were essentially the same as they were in 2019. Since then, I’ve gotten additional visitation data, showing a drop. That kind of volatility is likely to be this summer’s theme.
The remainder of this edition focuses on how COVID-19 affected Jackson Hole’s taxable sales economy in March and April, the most recent months for which data are available.
- Yellowstone Visitation: May 18 – June 20
- Taxable Sales During COVID-19: Introduction
- Two Quick Explanatory Notes
- Big Picture
- Sales by Season
- COVID-19-related Losses in March & April
- How Locals Spend Money
- On-line Purchases
- Looking Ahead
The combined big take-away of the two pieces of research? This summer, Jackson Hole’s economy may end up doing better than we feared.
Thanks for reading, and I look forward to hearing your thoughts, reactions, and comments.
Jonathan Schechter
Executive Director

Yellowstone Visitation: May 18 – June 20
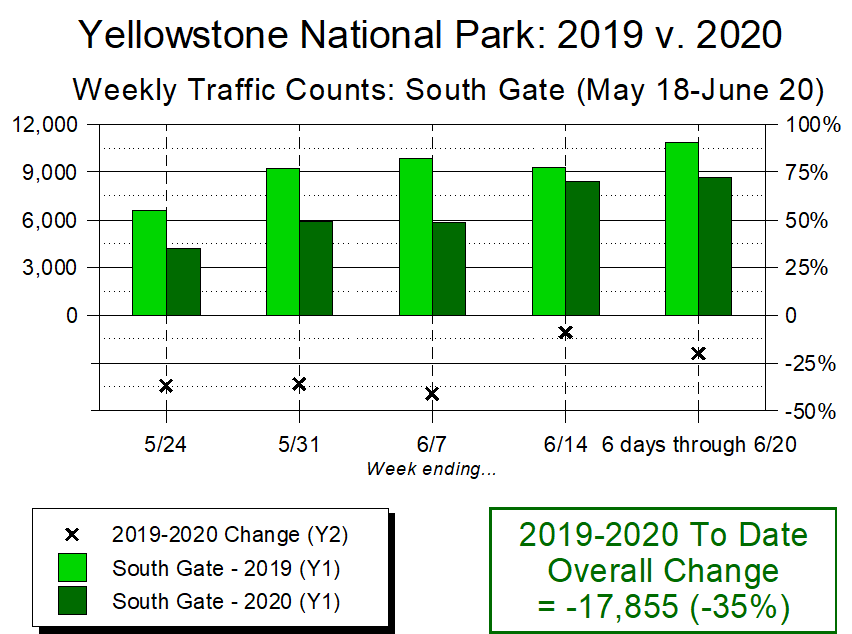
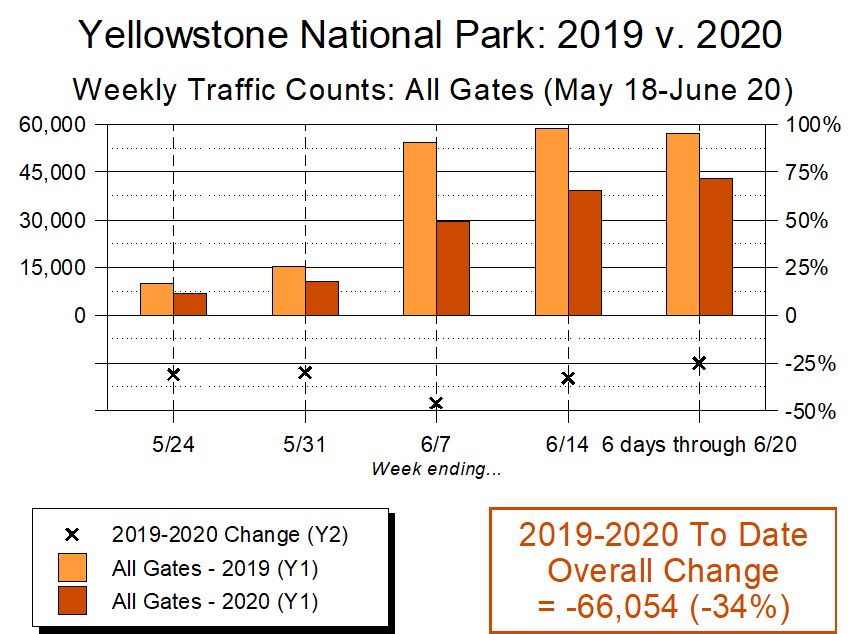
This summer, on a weekly basis, Yellowstone National Park has been kind enough to provide daily vehicle counts for each of its five weeks. Since my last newsletter, I’ve received an additional five days of data, and present them below in Figures A and B.
Yellowstone’s South Gate (Figure A) is its entry point from Jackson Hole. During the park’s first three weeks of being open in 2020, South Gate visitation was down markedly from the same days in 2019: 37%, 36%, and 41% respectively. Since the second full week of June, however (the week of June 8-14), visitation has picked up markedly – down just 9% the week of June 14, and 26% for the six days ending June 20.
Yellowstone’s overall visitation has not been as strong (Figure B). Of its four major gates (excluding the lightly-used Northeast Gate near Cooke City), traffic from the South Gate has clearly been the strongest.

Taxable Sales During COVID-19: Introduction
In the first week of June, the Wyoming Department of Revenue issued its most recent monthly sales tax collections report.
This was noteworthy because it provided the first comprehensive sense of how Teton County’s economy (at least its taxable economy) performed during a time of near-complete COVID-19-related economic shutdown.
Before exploring the data, though, a couple of contextual notes are in order.
Two Quick Explanatory Notes
Sales month v. reporting month
Let’s say you own a doughnut shop in Jackson, and sold $1,000 worth of doughnuts in April. By the end of May, you would be required to send Wyoming’s Department of Revenue $60 for the six percent sales tax levied on those sales. At the beginning of June, the department would combine your payment with all the others it received from Teton County in May, and send out the results. That was the report I received.
I mention this because the May report generally, but not perfectly, reflects sales in April. Why not perfectly? Because your $60 check would be included in the May report only if it arrived in May. If instead it arrived in June, it would be included in that month’s report. Similarly, if you check covering March sales arrived in May, it would have been counted in that month’s report. Big picture, though, May’s report generally reflects April’s sales, April’s report generally reflects March’s sales, etc.
The analysis below is drawn from the April and May reports, which reflect March’s and April’s sales, respectively. References are to the sales months, unless the term “report” is used (as in “May’s report”).
NAICS codes
The other thing to know is that, when the state issued the business license for your doughnut shop, it assigned a North American Industrial Classification System (NAICS) code to your account. There are 10 million such codes, including 7222133 for “Doughnut Shops: This industry comprises establishments primarily engaged in selling doughnuts, for consumption.” (This begs the question of what doughnuts are for if not consumption, but I digress.)
Using these codes, the state issues two reports of taxable sales by industry. The “Major” report identifies 20 different categories of industries using two digit NAICS codes (your doughnut shop falls under NAICS 72: “Accommodation and Food Services”). The “Minor” report classifies all of Teton County’s businesses into one of 306 different categories using the first four digits (your doughnut shop falls under 7222 “Limited Service Eating Place”).
These codes are the basis of the analysis below.
Big Picture
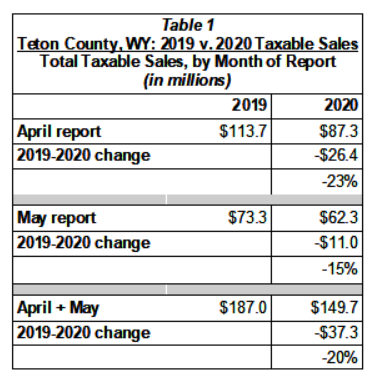
According to the May, 2020 sales tax report, Teton County’s merchants sold $62.3 million worth of taxable goods during April.
This represented a drop of 14.9 percent from April 2019’s sales. Yet because our economy was in a medically-induced economic coma in April, to me this not-even 15 percent drop seemed surprisingly small. Certainly it was smaller than the drop seen the previous month (reflecting March’s sales – Table 1). What happened?
Sales by Season
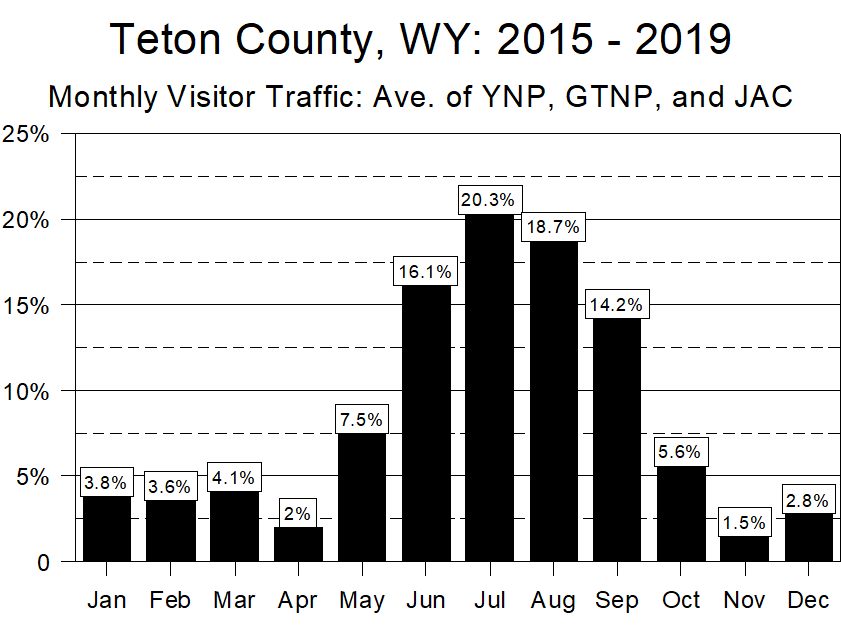
The first clue to explaining April’s relatively small drop lies with how taxable sales ebb and flow during the year. Historically, April and November vie for the slowest month of the year. As Figure 1 shows, over the past two years April has had the lowest percentage of Teton County’s total taxable sales, and May has ranked third.
The reason, of course, is that April is when the ski areas close and many residents go on spring break. If you make the crude assumption that the number of tourists who ski in early April balances out the number of locals who leave for spring break, then the April figure becomes a rough proxy for pure local spending.
Which, as Figure 2 shows, basically matches up with visitation data. Averaging the amount of monthly activity at the Jackson Hole Airport with that of Grand Teton and Yellowstone national parks, March and April are very slow (especially if you consider that much of late March’s air traffic is locals getting out of town for spring break).
The long and the short of it is that, if we had to get shut down by COVID-19, we got exceptionally lucky that the period affected was mid-March through mid-May. Arguably no other time of year would have been so fortuitous.

COVID-19-related Losses in March & April
Knowing the seasonality of our taxable sales also helps us better understand why May’s drop was surprisingly low.
Here’s a little basic math. As our baseline, let’s use the total amount of taxable goods local merchants and hoteliers sold during the fiscal year that ended February 29: $1.66 billion. Let’s also assume that the local tourism economy shut down on March 16, the day Jackson Hole Mountain Resort and Grand Targhee shut down.
Had COVID-19 not struck, then using Figure 1’s monthly taxable sales percentage, in March we would have expected to see $1.66 billion x 6.7%, or $111 million in taxable sales.
Instead, in March we got $87.3 million in total sales, a total decline of $23.8 million (21%) from the expected amount. (Table 2)
Do the same calculation for April, and we would have expected to sell $1.66 billion x 4.6% = $76.3 million worth of taxable goods. The actual, however, was only $62.3 million, a $14.0 million decline (18%).
Combined, in March and April Teton County’s taxable sales were $37.8 million lower than we would have expected, a drop of 20%. $16.8 million of that was due to the decline in tourists’ spending and the remaining $21.0 was due to a decline in non-tourist spending.
Put another way, tourists accounted for 44 percent of the $37.8 million drop in combined March and April taxable sales, while all other sources accounted for the remaining 56 percent.

How Locals Spend Money
That only 44 percent of the drop was due to a decline in tourist-related spending may seem surprising, but for two reasons it makes a lot of sense. First, only half of March was lost, and by all accounts tourist spending was robust in the first half of March. Second, even in a normal April there is essentially no tourist business. Had the COVID coma occurred at any other time of year, the tourists-to-non-tourist ratio would have likely been more skewed toward tourists’ expenditures.
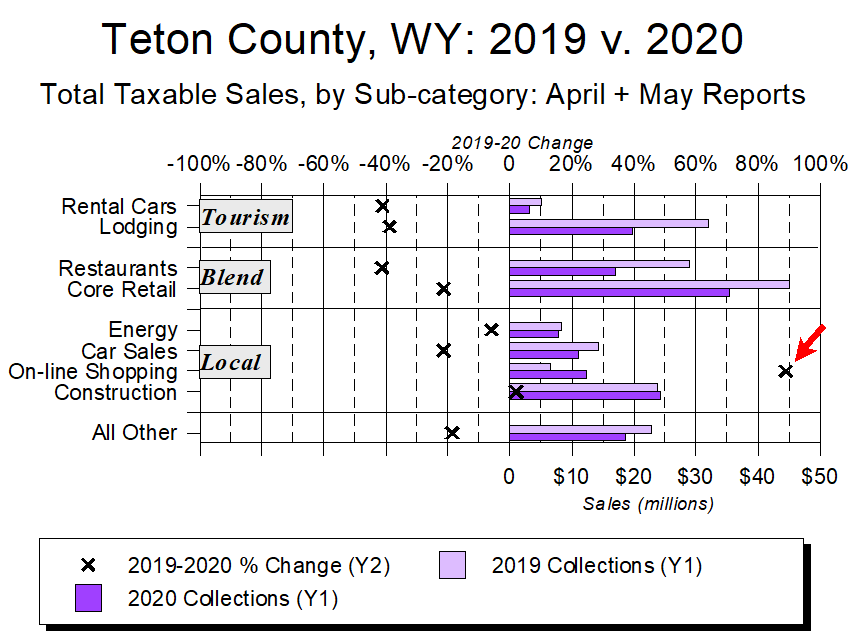
Taking a closer look at how locals spend their money, as noted above the Department of Revenue’s monthly “Minor” reports associate each one of Teton County’s businesses with one of 306 NIAICS four-digit codes. Using these to determine whether a business serves tourists, locals, or a combination yields the sort of analysis shown in Figures 3-5.
Figure 3 shows the figures reported in the May report, broken down into the four basic categories of Tourism, Tourism/Local Blend, Local, and All Other. (Note: Because this section’s analysis is more granular than the one above, the two sections’ numbers don’t quite line up. Their gist is the same, though.)
The big take-away from Figure 3 is that April 2020’s tourism-related sales were off by about half from the previous year, local-related sales were about break-even, and those in blended categories basically split the difference.
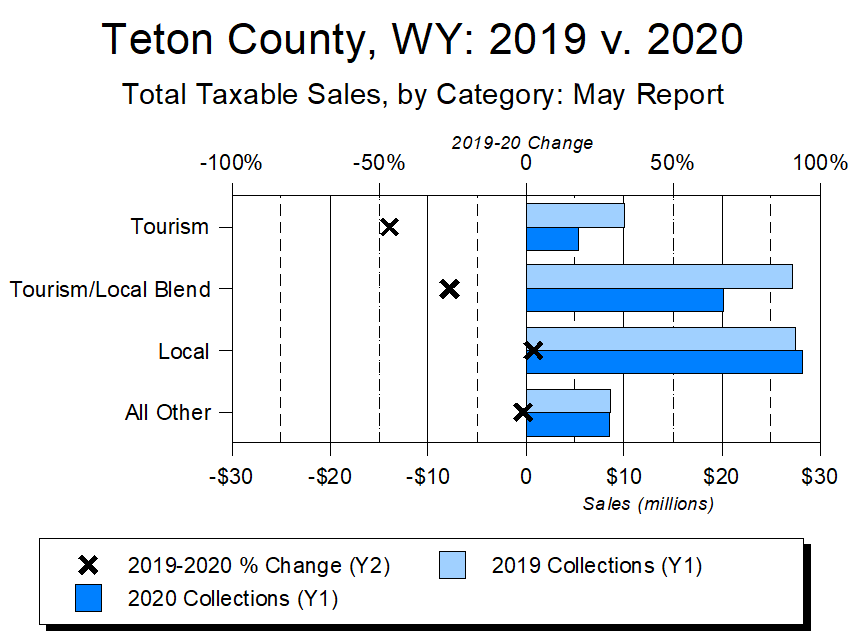
Figure 4 breaks the first three categories into their respective sub-categories. Four things jump off this graph.
First, while the two basic “pure” tourism categories of Rental Cars and Lodging took big hits in April, they did not go away altogether. In part, this is likely due to late-arriving payments for sales taxes collected in March. Late payments can’t account for everything, though, so it’s likely some of April’s lodging sales were likely due to the “essential workers” who needed places to stay. Another part may be due to the fact that many downtown motels have been converted into seasonal or even year-round residences for Jackson Hole’s workforce.
Second, because they were not exclusively dependent on tourists, the “blend” categories fared better than the core tourism categories.
Third, the pure “local” categories did better than pure or blended tourism categories.
Fourth, only two categories of business showed an uptick in sales during April: Construction and On-line Shopping. The former was up a solid 7 percent; the latter was up an astonishing 87 percent (more on that in a moment).
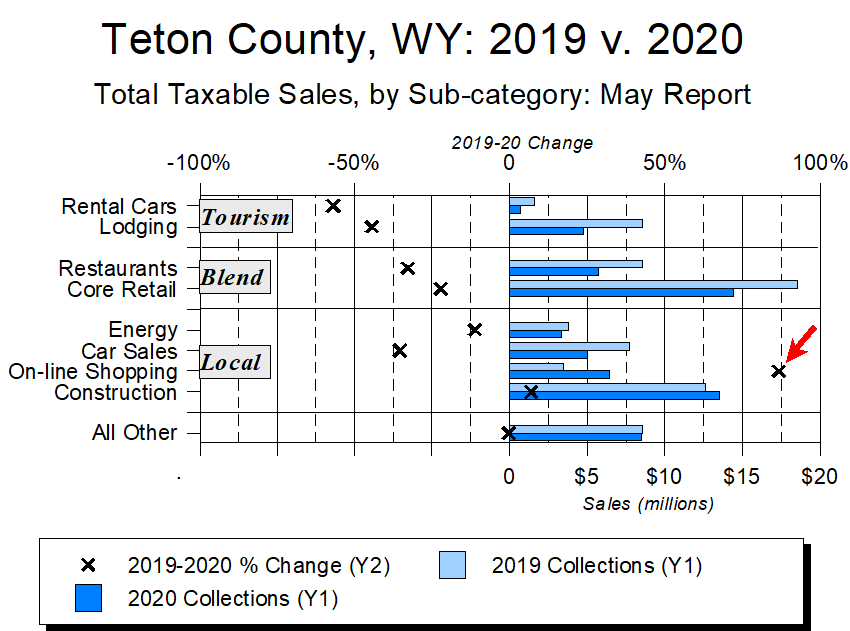
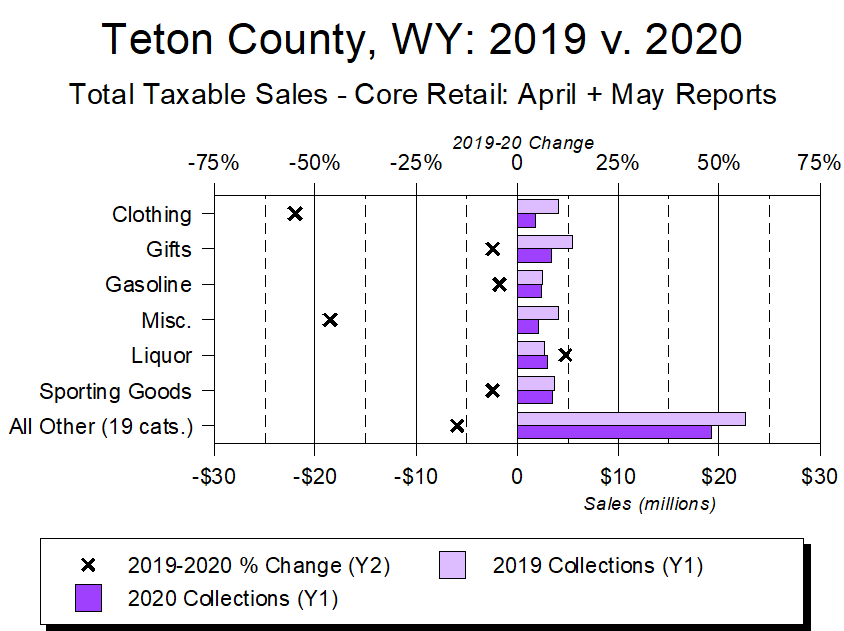
Figure 5 looks at different sub-categories of Figure 4’s “Core retail” category, and it gets at one other interesting phenomenon.
During April, two retail sub-categories actually showed growth from 2019. One was Sporting Goods, up 22 percent (best guess: retailers trying to liquidate merchandise). The other was Liquor, up 53 percent (best guess: whatever it takes to get you through a very difficult month).
It’s also notable that gasoline was down as little as it was, especially given how much gas prices fell during the month.

Figures 6-8 show the same data for the April and May reports combined (i.e., the reports reflecting March and April’s sales). For good or ill, over the course of these two difficult months, the one retail category which grew was liquor.


On-line Purchases
So what about on-line purchases? In March 2020, they were up 93 percent over March 2019; in April they were up 87 percent; for the two months combined, a near-doubling at 90 percent.
Which, to put it mildly, is a stunning rate of growth, especially when compared to the 21 percent decrease in all other retail sales during the combined months of March and April.
This growth rate becomes even more eye-popping when we consider that, during March and April, on-line shopping accounted for 25 percent of all of Teton County’s retail sales, accounting for $12.4 million of Teton County’s total retail expenditures of $47.9 million.
And if that weren’t enough, take away on-line sales, and Teton County’s combined total taxable sales in March and April combined would have fallen an additional fifth, from 20 percent to 24 percent.
So what’s going on?
Three things, really.
First, during the pandemic, with a lot of stores closed, people turned to on-line shopping. Not just in Jackson Hole, but across the country.
Second, because so few tourists were here in March and April, retail sales were at their annual nadir. As a result, on-line sales could account for a much higher percentage of overall totals.
There was a third, more Wyoming-specific reason, though, for what appears to be such a huge jump in on-line taxable sales. This was a change in Wyoming’s sales tax laws.
As Figure 9 illustrates, through the first quarter of 2017, on-line retailers could sell goods to Wyoming residents and businesses without charging buyers any sales tax. This, of course, put Wyoming merchants at a big disadvantage, one that started to change in April, 2017, when Amazon began charging Wyoming customers the sales tax applicable in their county.
Commerce being what it is, all this led to a big court fight, which was eventually decided in the state’s favor. When that occurred, all on-line merchants selling into Wyoming had to charge sales tax (this happened in April, 2019, as indicated by the purple arrow in Figure 9).
The law being what it is, though, it turns out the ruling didn’t cover every on-line activity. This is because the on-line sales world is broken into two general categories of merchants: sellers and facilitators. Amazon is a hybrid of the two, selling some things directly and serving as an on-line clearing house, or “facilitator”, for other vendors. Last July, those facilitators were finally subject to sales tax, meaning that as of July 2019, essentially all on-line sales into Wyoming are taxed at the rate applicable in the recipient’s home county.
As a result, since last July Teton and other Wyoming counties have seen a huge surge in sales tax collections under the 2 digit “44 – Retail Trade” category. That artificial growth stimulus will end in another month, though, allowing us to directly compare growth in local local bricks and mortar retail to its on-line counterpart.

Looking Ahead
When we are able to make such “apples-to-apples” comparisons between types of retailers, though, I’m concerned our local bricks-and-mortar retailers will not fare well. This is because even before COVID-19, things were not looking good for Jackson Hole’s traditional retailers.
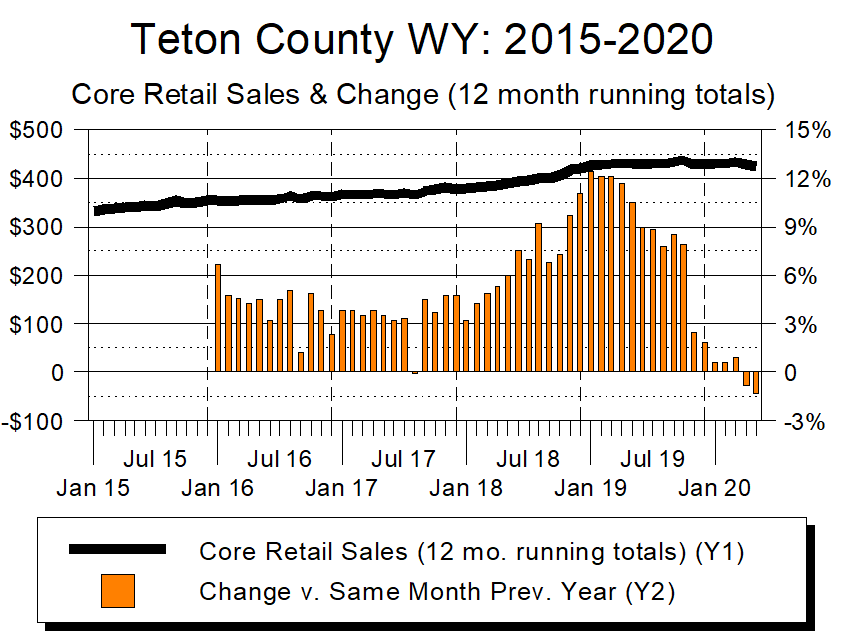
Retail is the single biggest category of Jackson Hole’s taxable sales economy. Back out building materials and on-line sales from overall retail sales, though, and this remaining “core retail” sector had essentially stopped growing before the pandemic struck. In particular, starting last fall growth dropped dramatically and, put charitably, had become anemic even during the halcyon pre-COVID days. Strong sales in building materials and, especially, on-line shopping were hiding this weakness among our core bricks-and-mortar retailers, but it’s been there for a while.
The concern, of course, is that our local bricks-and-mortar retail sector was not in strong shape going into what will arguably be Jackson Hole’s most fateful summer in decades – at least since 1988, and maybe for decades before that.
None of us knows what will happen this summer, but given how dependent so many of our retailers are on summer, it suggests many anxious weeks ahead for them. Combine that with the undoubted growth in locals’ on-line shopping, and it’s a fraught time to be a Jackson Hole bricks-and-mortar retailer. As much as it pains me to write this, my fear is that, six to twelve months from now, Jackson Hole’s retail scene will be much less-vibrant than it has been over these last few years.
