Hello, and happy October!
With my Asphalt Period behind me, this newsletter loops back to something I discussed in the September 12 CoThrive: my myriad concerns about how we choose elected officials.
Because I hate it when people complain without offering solutions, this CoThrive offers an example of what I think should occur during campaigns. In particular, today’s issue presents the answers to a question I posed last week to every candidate for county commission, mayor, and town council: Why should someone vote for you instead of your opponent(s)?
To me, this is the fundamental question every voter faces when entering the voting booth. Weirdly, though, it is never asked of candidates, even indirectly. To remedy that, below you’ll find responses from all 10 candidates.
As I see it, the responses are a 300-word creative exercise, a chance for each candidate to express themselves as they wish. As a result, there’s meaning in both what each candidate says and what they don’t say. It also means that each candidate’s response is a clear expression of their uniqueness as individuals.
To set the stage, I’ve preceded the responses with a quick overview of my concerns about our election system. Following the responses is a copy of the solicitation email I sent each candidate.
The responses are grouped by contest, and presented in alphabetic order. With the exception of making the formatting uniform, each candidate’s 300-word response is presented just as I received it.
- The Disconnect Between Running for Office and Governing
- Teton County Commission
- Len Carlman (Democrat)
- Natalia Macker (Democrat)
- Melchor Moore (Republican)
- Vicky O’Donoghue (Independent)
- Jackson Mayor
- Jessica Sell Chambers
- Arne Olaus Jorgensen
- Jackson Town Council
- Scott Anderson
- Kevin Regan
- Perri Stern
- Devon Viehman
- The Solicitation Email
For readers in Teton County, Wyoming, I hope you find the responses of value. For those living elsewhere, I hope you find resources in your community that shed light on the races that matter to you.
As always, thank you for your interest and support.

Jonathan Schechter
Executive Director
PS – Asking candidates this one question feels like a good idea to me, but I have no idea how well it will work for you (if at all…).
To that end, after you read the candidates’ responses will you please let me know what you think about the concept, format, and overall exercise? I’d obviously love to hear any thoughts you have about particular candidates, but the two big questions I want to answer are:
- Does this approach have merit? and
- Should I do it again in future years?
Thanks in advance for your help.
To learn more about CoThrive, click here
To subscribe to this newsletter (it’s free!), click here
To donate to support this newsletter, click here

The Disconnect Between Running for Office and Governing
When it comes to how America elects candidates for office, I have three basic concerns.
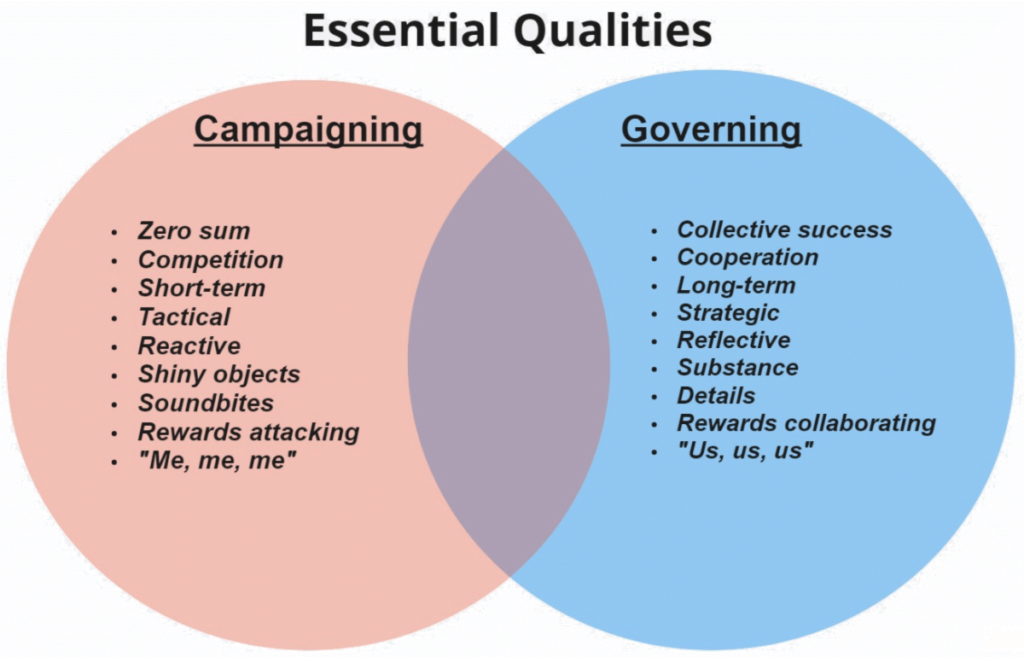
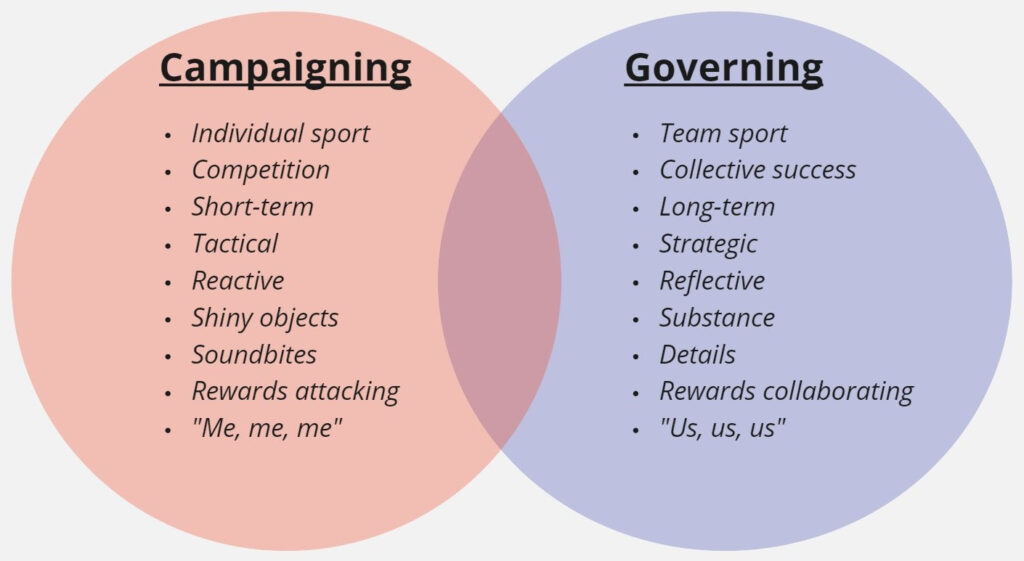
Concern 1: The Skills Disconnect
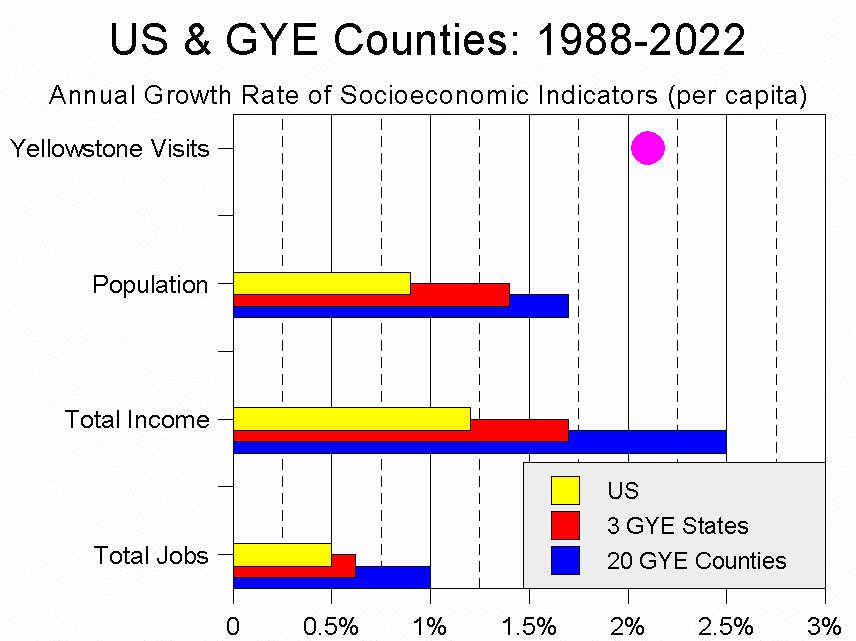
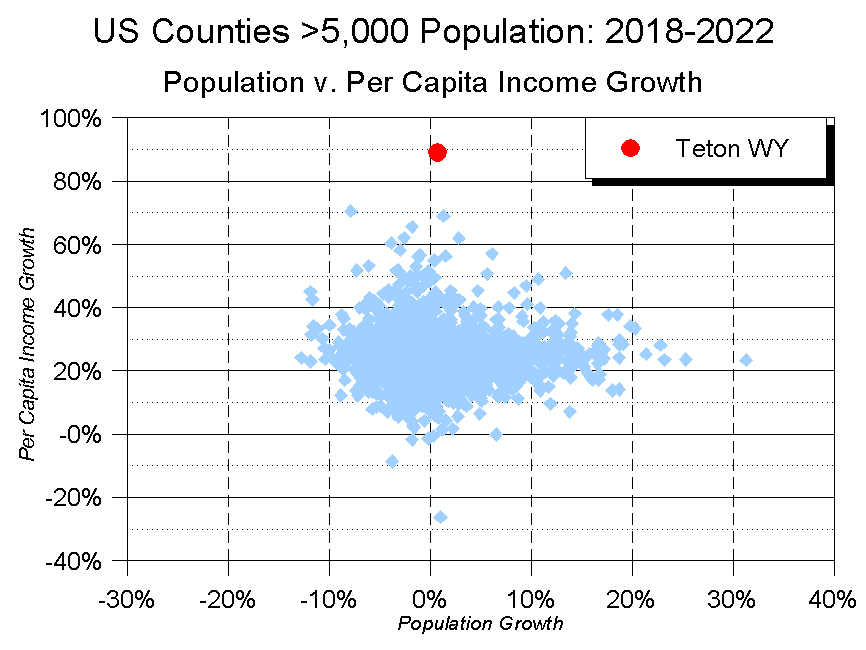
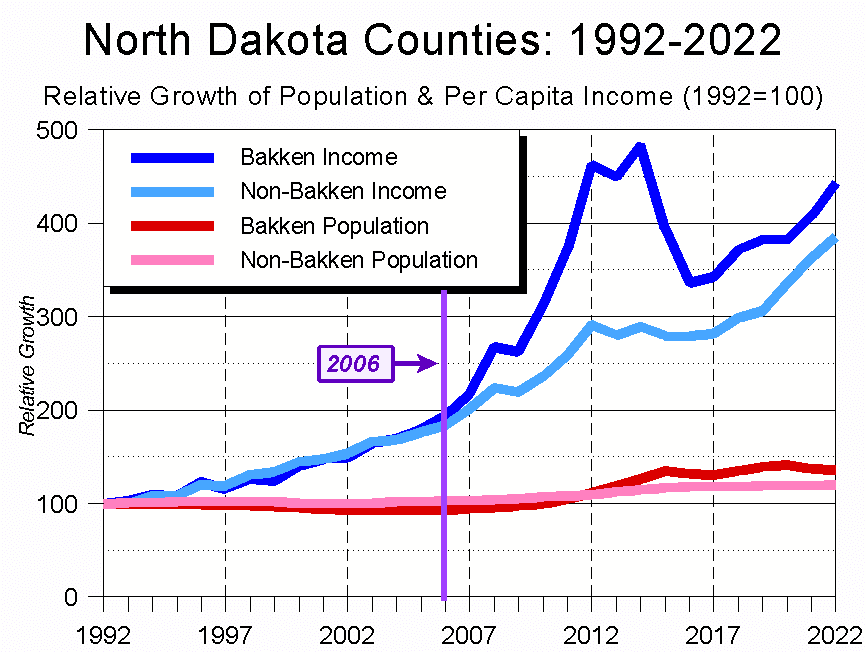
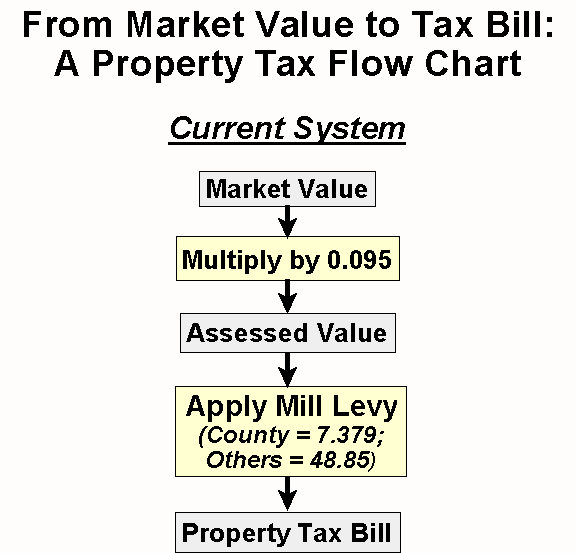
The skills a person needs to be a successful candidate for elected office are very different than those they need to be a successful elected official. Unfortunately, campaigns rarely shed light on whether someone has the skills needed to successfully govern. (Figure 1)
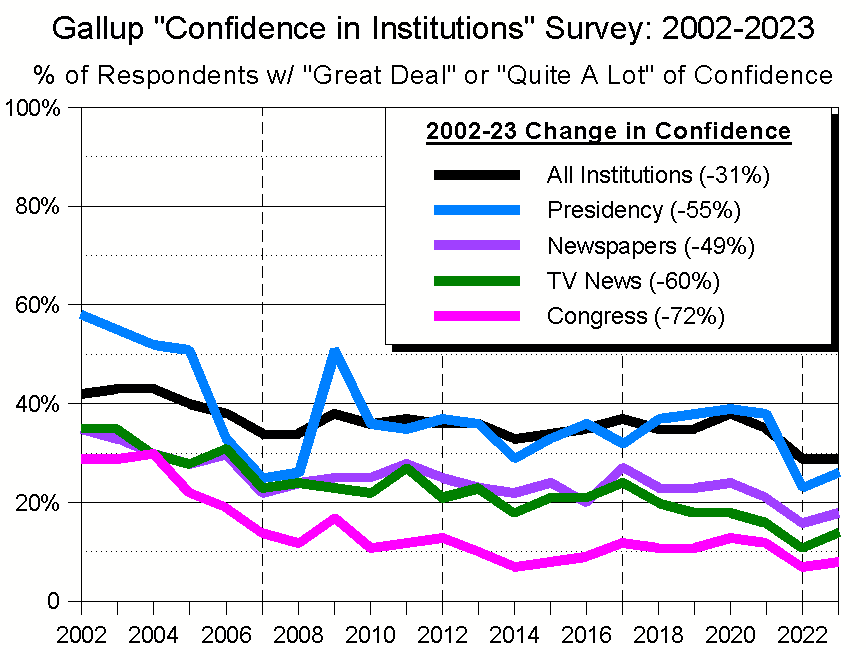
Concern 2: How We Learn About Candidates
The way voters learn about candidates is profoundly dysfunctional.
Rather than highlighting true differences between candidates, or helping voters understand how those differences might affect the future, the systems we have – in particular both traditional and social media – too often treat campaigns like sporting events. The focus is on who’s up and who’s down, and coverage breathlessly emphasizes sound bites, gotchas, bon mots, and other irrelevancies.
Unfortunately, while that kind of coverage may make for great clickbait, it doesn’t tell voters much about who might do well at governance or policy making.
What about debates and other forums? Sadly, they are essentially distillations of the worst parts of campaigns. Why? Because they place a premium on quick responses to surprise questions, which are skills disconnected from those needed to effectively govern; i.e., the ability to consume, consider, and act upon large amounts of complex, sometimes conflicting information.
Like a major sporting event, debates and other staged events are easy to explain and therefore easy to cover. In that way they clearly benefit consultants, chattering classes, and others who make money off of campaigns. Rarely, however, do they cast any meaningful light on who might govern effectively.
And then, of course, is the pinnacle of awfulness: Advertising, particularly attack ads. Perhaps such ads help get candidates elected; perhaps they don’t. What I’m sure of, though, is that they do little to elevate public discourse, and even less to leave one feeling good about oneself or one’s government.
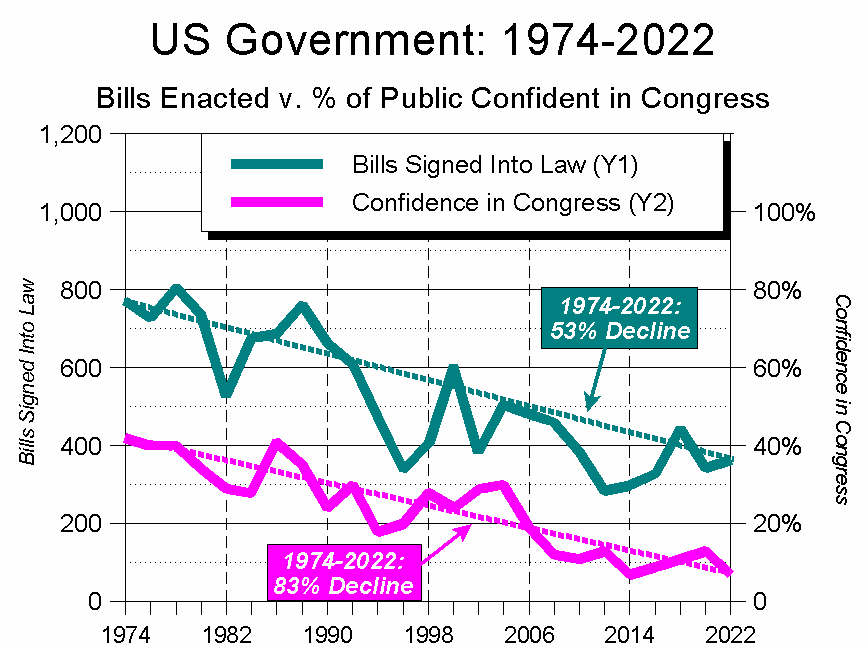
Concern 3: Confusing Means and End
Given the disconnect between successful campaigning and successful governance, is it any wonder that increasingly fewer elected officials have the skills, temperament, or even desire to govern well?
Getting elected should be the means to an end; i.e., you run not to run, but so you can govern. Over the past few decades, though, running has increasingly become an end in itself (think about the attention, fundraising opportunities, and other benefits enjoyed by good candidates).
In this Looking Glass world, successful candidates are rewarded not for governing well, but for staying in perpetual campaign mode. And if that’s the case, why bother with the dull, plodding, difficult work of trying to get things done legislatively?
Add in the fact that few elected officials pay a price for not governing well (if at all), and choosing to actually govern increasingly looks like a sucker’s pursuit.
So that’s what I don’t like. What do I like? Straight answers to meaningful questions. That’s why I asked the candidates to answer the fundamental question facing voters: Why should I vote for you instead of your opponent(s)?
Here’s what they had to say.

Teton County Commission
Of the four candidates running for this partisan office, two will be elected to a four-year term. Among the candidates, only Natalia Macker, an incumbent, currently holds local elected office.
Len Carlman (Democrat)
No other candidate has my depth of experience on the issues that matter most.
From leading the JH Conservation Alliance in the 1980s to showing up at climate change education programs, including the Mountain Towns 2030 Climate Solutions Summit October 15-16 of this year, I’ve always championed a sustainable future for Teton County. That focus was baked into my DNA when I was a 16-year-old student at the six-week field ecology course at Teton Science School.
In 1984, I lobbied in Washington, DC, for the successful Wyoming Wilderness Act. In the early 2000’s, I helped save and restore the Old Wilson Schoolhouse Community Center. I authored the first-in-Wyoming land use regulation to stymie unauthorized private feeding of big game in subdivisions. In 2006-2008, I was on the leadership team that stewarded the Snake River Headwaters Wild & Scenic Rivers Act. I helped lead the effort to buy, restore, and relaunch Hungry Jack’s General Store in Wilson where we feature locally grown food.
My wife Anne Ladd and I raised a strong Jackson Hole family: Madeline – 27, Reed – 24. From diapers and daycare to school and sports, we’ve done it. I see the world and its future through their eyes too. I’ve hiked and backpacked through the Wyoming Range, the Snake River Range, the Tetons, the Winds, the Gros Ventres and around Yellowstone. I’ve kayaked and rafted down every watershed in the greater Yellowstone ecosystem. My career as a Wyoming lawyer, 1996 to present, has helped me understand how to turn ideas into policy. Non-profit boards: Wyoming Outdoor Council, Teton Raptor Center, Interconnections 21 (Model UN), Friends of Pathways, Community Children’s Project, Snake River Fund, Wyoming Community Foundation.
I understand the needs and unique challenges of Teton County. I do what I can to turn good ideas into good results.
Natalia Macker (Democrat)
It has been an honor to serve as a Teton County Commissioner since 2015. I love local government because we work side-by-side with the community. As a pragmatic problem solver, I know how to bring people together and get things done. I began my career in public service on the Parks & Rec Board in 2013 and in my tenure since I have witnessed tremendous acts of courage throughout our community as we respond to whatever comes our way. I share that care for our community and commitment to hard work towards our vision for a healthy, thriving county.
My leadership roles outside Teton County help me build valuable relationships and insights that benefit our community. I am the Vice President of the Wyoming County Commissioners Association and serve on the Wyoming Community College Commission.
As I look to another term, I am focused on water quality action, affordable housing, and more investment in early childhood education. I’m a working mom, and I remain focused on building a prosperous future for our community while caring for my family, for yours, and for this beautiful place
“A vote for Natalia is a vote for dedication, commitment, and common sense. Natalia juggles the responsibility of a family with 3 children and the leadership of Off Square Theatre while still finding time to be thoroughly involved in the details of running Teton County. Her effective involvement is worthy of your vote.”
– Former Town Councilor Bob Lenz
“Commissioner Macker is genuinely engaged with our community and stands up for Teton County. Her experience and thoughtful actions prove she’s an intrepid leader who goes the distance, no matter the issue. I’m proud that she represents me, my family and neighbors; especially our most vulnerable community-members. I can’t wait to vote for her!”
– Amy Madera
Melchor Moore (Republican)
We need people in government that understand how changes to legal documents are made rather than individuals who don’t understand administrative process.
I’ve worked for the government court and legal system for over a decade as a paralegal and in administration, so I understand how changes to documents and administrative procedure are made.
The current Commission is in violation of keeping up with its updates to its own development regulations and I believe that this is because we have commissioners that don ‘t fully understand the administrative process.
Commissioners that do not understand the administrative process are subject to the direction of advocacy organizations. The use of private funds is very good to provide for research and to inform the people, and to provide services to people that cannot afford them. However, advocacy organizations are run by a pool of money that investors use to obtain these services, and when private fund investments are used to run the government of the people we begin to see a ruining of the initial intention of non-profit philanthropy.
The people of Jackson Hole and Teton County should vote for me, because I am fresh to politics, and haven’t received the political action committee monies that my opponents use to further their investors’ agendas. As a sixth generation Jacksonite, I represent the generational families of our community, but also understand that there is new growth that we need to represent as well.
I am the Republican candidate for county commission, but participate in and contribute to the arts, theater and dance, as well as the industrial blue collar Rodeo crowd that hunts and fishes. I believe that we need a commissioner that represents both groups.
Vicky O’Donoghue (Independent)
My decision to run for County Commissioner was driven by my deep connection to the Jackson Hole community, where I’ve lived and served for over 27 years. Throughout this time, I’ve had the privilege of raising my son here, and now I feel a calling to give back to the community that has given me so much. From coaching youth soccer and lacrosse to teaching safe driving to many students, I’ve always been an active participant in helping others, and my aim is to continue that service on a broader scale as County Commissioner.
Why should you vote for me?
I pride myself on being a “people person” with strong communication and leadership skills, qualities that are essential for the role of County Commissioner. My motto, “Unity with the community through communication,” highlights my belief in the power of listening and working together. My experience as a team leader, honed through my sports career and my work with the United States Field Hockey Association, has equipped me with the ability to collaborate effectively and to foster a sense of teamwork. If elected, I will bring fresh perspectives and a commitment to representing the voices of all community members.
What are my goals if elected?
I intend to focus on stewarding the community’s existing assets—improving infrastructure, housing, and accommodation for both residents and businesses. I believe in promoting better transparency, communication, and collaboration between the workforce, local departments, and the community at large. Lastly, I am committed to preserving the unique character of Jackson Hole, ensuring it remains true to its Old West roots while adapting to the needs of the future.
Jackson Mayor
Of the two candidates running for this non-partisan office, one will be elected to a four-year term. Both candidates currently serve on the Jackson Town Council; neither is the incumbent mayor.
Jessica Sell Chambers
Why vote for me? Like Franklin Roosevelt during the Great Depression, Jackson faces the pressing challenges of economic strain, social inequality, and the need for bold leadership. Sounds extreme? We’re $4 million over budget with a cliff ahead, with housing, childcare, and tax crises pushing folks out, while trying to balance growth with environmental preservation. We haven’t had the visionary leadership this moment demands. Like Roosevelt, I am assembling a brain trust of experts and local leaders to develop innovative, practical solutions. Jackson is small but mighty—with focused leadership, we can get to work.
First 100 Days Action Plan
- Zero-Based Budget
- Advocate for zero-based budgeting across all departments ensuring every dollar is focused on public health and safety, public works, infrastructure, and housing.
- Municipal Finance Expert
- Call for a municipal finance expert, essential in a fiscal crisis, to provide innovative solutions beyond our current finance team’s capacity. Their expertise will address the shortfall and plan for a sustainable future without unnecessary tax increases.
- Mayoral Housing Summit
- Gather developers, community leaders, and officials to set clear, actionable community goals for affordable housing projects.
- Mayor-Community Engagement
- Organize town halls and listening sessions to engage residents on budget priorities, housing, and small business support, ensuring transparency.
- Small Business Outreach
- Review bureaucratic processes with small business advocates to ease the path for small businesses to succeed
- Empower the Equity Task Force
- Support the ETF to provide recommendations for inclusive policies and monitor the impact of town initiatives.
- Comprehensive Plan and Design Review Update
- Seek a nationally recognized firm to develop an updated comprehensive plan to fix zoning and regulations to secure the sustainable community we want.
Call me crazy, but by leveraging leadership, local expertise, and outside guidance, I’m confident we can drive meaningful change while preserving both who and what make Jackson unique.
Arne Olaus Jorgensen
Jackson is a place with unique natural beauty and it is a place with an engaged, passionate population. I am running for mayor of Jackson because I am committed to preserving what makes Jackson unique while representing the diverse voices of all our people. Growing up here, my parents and mentors instilled in me a profound appreciation for our natural and built environment, teaching me the importance in considering both of these things while serving the public. It’s crucial we maintain and strengthen our sense of community, especially as we face large challenges of housing instability, protecting our natural resources, and ensuring that we have a great quality of life. As Mayor, I aim to bring everyone’s voice to the table and use my knowledge and understanding of our diverse perspectives to foster inclusive dialogue. I am excited to work toward a future that focuses on thriving as a community while honoring the place.
I humbly ask for the votes of our community based on my values and how I have shown up for all members of our community, particularly over my time on the Town Council. Examples of how I have conducted myself and how I would do so as Mayor include:
- I do not lead by tearing down or embarrassing others but by supporting colleagues in finding common ground;
- I fully embrace leadership that is quick to share success;
- I am respectful of staff and the public as they engage with Council;
- I am there for the work and am fortunate to have been able to attend nearly all of our meetings; and
- I work hard to support all of my colleagues and Town staff to do all they need to take care of themselves and family.
Jackson Town Council
Of the four candidates running for this non-partisan office, two will be elected to a four-year term. None of the candidates currently holds a local elected office.
Scott Anderson
Experience.
Having served for 12 years on the Jackson Town Council, I am the only candidate with the specific experience of overseeing the town budget process, being part of the comprehensive planning process, and ensuring that the operations of the town are efficient and streamlined.
I also have the experience of working with numerous other elected officials over the years including five different mayors and five different town administrators. It is important that a town councilperson be able to have good relationships with their counterparts in order to work together to make things better for the people who live in Jackson.
Experience and an understanding of the role of a town councilperson are what make me different that my opponents.
Kevin Regan
Our town faces pressing challenges when it comes to protecting our environment, improving our transportation systems, and addressing our housing crisis. I believe that I have the experience, temperament, and skills to bring a balanced voice to Town Council at this critical time.
Growing up on a dirt road, I saw how shortsighted policy decisions impacted our environment and community character. The fields and forests I played in were paved over to make way for strip malls. The sense of loss I felt motivated me to pursue environmental law in order to be able to defend our natural spaces and all those who call them home. I want us to make intentional decisions about how Jackson evolves.
I have been lucky to work for the past two decades as an environmental and intellectual-property attorney for organizations like Earthjustice and the U.S. Department of Justice. I am most proud of my time as the Law and Policy Advisor for Protect Our Water Jackson Hole, where I fought to protect water in town and throughout the Snake River watershed from E. coli, pollution, and irresponsible development. I currently serve on the START Board to represent those who, like me, rely on public transportation. And I was humbled to receive an endorsement from ShelterJH as a champion for affordable housing. In all these roles, I have consistently made balanced decisions that consider our immediate needs and our long-term vision as a community.
If elected to Town Council, I will work tirelessly for a future where our water is clean and our environment is protected; for a town with a diversity of transportation options that work for everyone; for a strong community with truly affordable housing for our workforce and families. My name is Kevin Regan, and I am a balanced voice for Jackson.
Perri Stern
Fed up with over-development and its far-reaching impacts on our town?
Feel like this unique place is slipping away?
Prefer substance over fluff?
My campaign is based on specific issues, clearly stated positions and practical solutions. Here’s why you should vote for me, Perri Stern:
- I am consistent and transparent.
- Some offer vague clichés or platitudes to win your confidence. But how will they vote? Others are beholden to special interest/advocacy groups, or have a conflict of interest. How will they stay neutral?
- I am my own person. I will always tell you what I think, give you a straight answer, and keep my word because that’s what you deserve.
- I demonstrate the maturity, temperament, good judgement and leadership that you expect and we need.
- No drama, no divisiveness, no alliances.
- Yes, I may seem a bit “stern”…., but I will always work to pull our entire community together. I welcome different opinions and perspectives, and have a wry sense of humor about myself. Get to know me; you won’t be disappointed.
- I’m pragmatic and responsible.
- Most will agree in private, but I am the only candidate who has stated in public that we cannot build our way out of our long-term housing shortage.
- I will always insist on due diligence and will spend your money prudently. I believe the overall quality of what we do is as important as the quantity that is produced. You deserve no less.
- I’m dependable and ready!
- I am a highly motivated self-starter; not new to the issues, the work, or our town.
- I combine a strong historical perspective with a hopeful, forward-thinking approach. It will be hard work, but it will be worth it. Join me!
Early Voting Begins October 8!
Perri Stern for Jackson Town Council
perriforcouncil.com
perriforcouncil@gmail.com
Devon Viehman
Jackson Hole is more than a beautiful place—it’s a responsibility. I grew up here, and like many of you, I believe in protecting what makes this valley special. My mom instilled in me a deep respect for nature, and I continue her legacy by tending our organic vegetable garden at our family home on Cache Creek Drive—where lower speed limits help protect local wildlife, including our famous grizzly 399 and her cubs, who have visited my yard. As a young girl, I attended Teton Science School camps, where Mardy Murie inspired my love for our precious ecosystem.
As a County Planning Commissioner, I’ve advocated for updated wildlife regulations, including bear-proof trash cans and wildlife-friendly fencing. My work has shown that we can balance growth with conservation, as I did while leading the National Association of Realtors’ Land Use & Environment Committee to pass its first-ever climate change policy. That same commitment carried me to Washington, D.C., where I lobbied for climate provisions in the Infrastructure Investment and Jobs Act and the Inflation Reduction Act—laws that will promote energy-efficient homes.
Locally, my family started the River Brigade after my mom’s passing, partnering with the GTNP Foundation to keep the Snake River safe for boaters. These personal and professional experiences have prepared me to address Jackson’s budget challenges—we are currently $4 million over budget. I’ve helped balance a $160 million budget at the nation’s largest trade association, and I will bring that same discipline here.
I have the experience, skills, vision, and heart to lead Jackson Hole forward in a sustainable, inclusive, and community-driven way. I understand our growth, challenges, and evolving needs. Jackson needs leaders who will take action now. I’m ready to be that leader.

The Solicitation Email
The following note was emailed to all candidates on September 23.
Hello candidates,
As you may know, my Charture Institute publishes CoThrive, an e-newsletter.
The most recent CoThrive discussed how being a successful candidate requires different skills than being a successful elected official. I also shared concerns about candidate forums and, more broadly, media coverage of political campaigns. In my view, forums, media coverage, and campaigns in general lend themselves to platitudes and sound bites, making it hard for voters to identify meaningful differences between candidates.
What to do? My answer is to have every candidate answer the fundamental question facing every voter in every election: ‘Why should I vote for Candidate X instead of Candidate Y?'”
Hence this email. Will you please tell me why people should vote for you instead of your opponent(s)?
I ask both because I’m curious and because I’d like to share your answers with CoThrive’s 4,000+ subscribers (over 2,000 typically open each issue).
In my next CoThrive, I will publish each response I receive. I will neither edit nor comment on any response. Instead, I’ll follow a quick introduction with candidates’ verbatim answers. That’s it.
Why am I doing this? Because come January, I’ll be working with November’s winners to help shape our community’s future. To that end, I want voters to make the most informed choices possible.
Why should you respond? To reach voters. CoThrive’s mix of local and regional subscribers gives you a free, easy way to make your case to people who care about our community.
To respond, please follow these instructions:
- Answer this question: “Why should people vote for you instead of your opponent(s)?”
- Word limit: 300 words
- Deadline: Wednesday, October 2 – 5:00 pm
- Publication date: Before early voting opens October 8
Thanks so much.
Jonathan
PS: As a reference, this email contains exactly 300 words.

To learn more about CoThrive, click here
To subscribe to this newsletter (it’s free!), click here
To donate to support this newsletter, click here