Hello, and Happy March!
So much has occurred since my last CoThrive that this edition is bursting at the seams. Thanks in advance for bearing with me.
In these newsletters, I use the introduction to highlight my major points, and the body of the publication to flesh them out. In today’s piece, I want to emphasize two thoughts. First, though, I want to talk about a really wonderful occurrence.
On March 12 I was lucky enough to attend a ceremony at which Jackson Hole High School fine arts teacher Collin Binko was awarded the 2024 Milken Educator award for Wyoming. Labelled the “Oscars of Teaching” by Teacher Magazine, the award came as a complete surprise to Collin and the rest of the assembly (see photo below).
Among the embarrassment of riches that is Jackson Hole is the quality and passion of not just our educators, but the hundreds of other local, state, and federal employees who give so much back to our community. A reason to be hopeful in these dark and uncertain times.

(Photo: Milken Family Foundation)
Turning to the subject of this newsletter, both nationally and statewide, new public policies seem to be based on little more than temperament and whim. If it’s any consolation, things were similarly untethered a century ago.
In response, in 1920 a group of scholars founded the National Bureau of Economic Research. Its mission was to provide policymakers with a foundation of economic facts and analysis. 105 years later, NBER is still going strong.
While NBER studies an array of topics, it’s best known for formally determining when recessions start and end. Because these pronouncements are made well after the fact, though, many people find them useless. As in: “Duh. I know a recession occurred. I just lived through it. Tell me something I don’t know. Better still, tell me something that will happen.”
Fair enough. But for people trying to understand the root causes of recessions and how to address them, NBER’s pronouncements are invaluable.
I mention this because today’s newsletter focuses on two points that might seem NBER-caliber obvious.
Point 1: Wages and Housing
According to the data, in 2024 Jackson Hole’s free market housing became officially unaffordable to a family earning two Jackson Hole wages.
That’s a blanket statement, and of course things are more nuanced than that. In particular, underlying the pronouncement are six constituent parts, which I examine in the analysis below:
Until 2024;
- there had always been at least one Jackson Hole industry;
- that paid a high-enough mean wage;
- to allow a two-income family;
- to afford a median-priced, free-market Jackson Hole condominium;
- based on wage income alone.
I’m not talking about a single-family home – that unaffordability ship sailed years ago. Instead, I’m talking about your basic condo, the starter unit for so many first-time home buyers. As of 2024, though, the data show that even that’s now out of reach.
And with that, Jackson Hole’s job market and its free-market housing market have become completely disconnected.
To me, this is existentially important. Why? Because a foundational belief – perhaps the foundational belief – undergirding the American economy is the idea that anyone who works hard can eventually afford to buy a home. If that’s no longer true, what other tenets of America’s economy are also suspect? Or at least Jackson Hole’s?
Speaking of suspect, in the same way NBER’s findings can be challenged, so too can someone pick apart my jobs-and-housing analysis. For example, I use mean wages, and there will always be people earning more than the mean. Similarly, by definition 50% of all condos are priced lower than the median.
Those and other objections noted, what the available data tell us is that, in 2024, Jackson Hole crossed a wages/home price threshold it had never crossed before. In turn, this suggests we need to ask some questions we’ve never asked before, including whether we like where we’re going. If not, we also need to ask ourselves the equally difficult question of what, if anything, we want to do about it.
Point 2: Jackson Hole and Silicon Valley
Taking a 30,000 foot view, all Jackson Hole businesses can be grouped into four basic categories:
- Tourism (which accounted for 45% of all Jackson Hole jobs in 2024)
- The combination of the Lodging, Recreation, Restaurants, and Retail industries.
- Location-Neutral (18%)
- The combination of the Finance, Information, and Professional Services industries.
- Construction (13%)
- All Other (24%)
From an employment perspective, Tourism is obviously the most important sector, employing more people than Location-Neutral and Construction combined.
From a payroll perspective, though, things are very different. Using this metric, Location-Neutral businesses pay more than Tourism and Construction combined:
- Location-Neutral (41% of Jackson Hole’s total payroll in 2024)
- Tourism (26%)
- Construction (12%)
- All Other (21%)
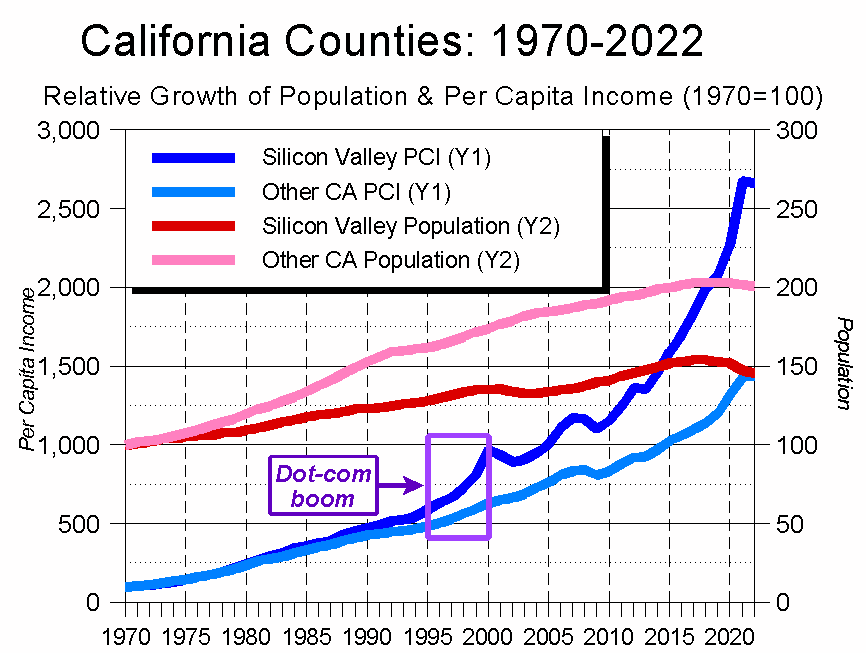
Divide Location-Neutral’s 41% of Teton County’s payroll by its 18% of Teton County’s jobs and the ratio is 2.3 to 1. In comparison, Silicon Valley’s figures are 62% of the payroll and 38% of the jobs, a ratio of 1.6 to 1.
Because of Teton County’s rapid growth in Location-Neutral jobs, and its even-faster growth in Location-Neutral wages, Jackson Hole’s socio-economic profile is rapidly morphing from that of an isolated, funky mountain town to a Mini-Me version of tech/finance/professional services hotbeds like Silicon Valley. That, too, is uncharted territory for this community and region.
Below is my analysis, along with a bit of commentary.
- Context
- Jobs, Wages, and Income
- Affording Housing
- Discussion
As always, thank you for your interest and support.

Jonathan Schechter
Executive Director
PS – Were she still with us, March 12 would have marked my mother’s 95th birthday. I was in utero the first time she and my father brought me to Jackson Hole, and to the end of their lives they cherished this valley and this community. My brother, sister, and I were very lucky in our parents; I try to honor that good fortune through CoThrive and my other efforts.

Context
This analysis is framed around three dates:
- In 2009, the recession started to take its toll on Jackson Hole.
- In 2012, the recession started easing.
- 2019 was the last full year before the March 2020 onset of the COVID pandemic.
Between 2001-2008, Jackson Hole boomed. Population, jobs, wages, and taxable sales all grew at an average annual rate of slightly under 2%. Per capita income grew 7.5% annually, and the median single-family home price grew just over 9% annually. (Figure 1)
(Two notes: 1. All dollar figures are inflation-adjusted. 2. Coincidentally, 2009 was the year the Town of Jackson and Teton County began working on their current joint Comprehensive Plan, and 2012 was the year it was adopted.)

Once the recession hit, things became bleak: Of the major economic indicators, only per capita income showed any meaningful growth. Beginning in 2012, though, things started picking up, and during the rest of the 2010s, the community’s socio-economic growth was similar to that of 2001-2008.
Things changed again in 2019, and in hindsight 2019 is the year that ushered in Jackson Hole’s current era. Between 2019-2024, Teton County’s only stagnant socio-economic indicator was population, which fell slightly during that time. Most other major indicators – including jobs, wages, median single-family home prices, and per capita income – grew at record rates. (Figure 2)

Why have things exploded over the last half-decade? Simply put, because of the remarkable amount of money that’s flooded into Jackson Hole since COVID struck.
This influx is beautifully captured by IRS data showing the number of people moving into and out of Teton County each year, as well as how much income they earmed. (The most recent IRS data are from 2022.)
Using three-year averages, Figure 3 begins with the period straddling Jackson Hole’s emergence from the recession: 2011-2013. Moving through time, it ends with the three years commencing with 2020’s onset of COVID.
As Figure 3 shows, during the triennials leading up to COVID, similar numbers of households moved in and out of Jackson Hole each year.
On the income side, during each triennial those moving into Jackson Hole made roughly twice as much as those moving out. Also in each triennial, locals made more than either “out-migrants” or “in-migrants.”

Once COVID hit, though, while the numbers of out-migrants and in-migrants stayed about the same, the money got ridiculous. Not only did the people moving into Jackson Hole earn nearly four times more than those moving out, they also earned significantly more than the community’s “non-migrants.”
The effects of all this new money have rippled out in a variety of directions, including into Jackson Hole’s housing market.
Jobs, Wages, and Income
Jobs I
As noted above, the 2008 recession hit Jackson Hole’s economy pretty hard. To understand just how hard, compare America’s 2009-2012 job creation to Teton County’s. Or, more accurately, Teton County’s job non-creation.
Between 2009-2012, the total number of jobs in the nation as a whole grew by 3 million: from 129 million to 132 million. On a percentage basis, the three-year total was 2.5%.
In contrast, during that same period the total number of jobs in Teton County grew by 4: from 17,415 to 17,419. Four jobs in three years. 1.33/year. A total of 0.0%.
Since things started picking up in 2012, Teton County has added a total of 6,333 new wage jobs. An average of 528 new jobs/year, and an overall increase of 36%. Nationally, during those same 12 years the number of jobs grew at half that pace: 18%.
Jobs II
Since coming out of the recession, Jackson Hole’s economy has had two basic phases: the “pre-COVID” years of 2012-2019 and the “COVID-plus” years of 2019-2024.
In Teton County, overall job growth was faster during pre-COVID than during COVID-plus, averaging 3.0%/year and 2.1%/year respectively.
Far more important, however, was that during the pre-COVID years, job growth was evenly distributed across the four major industrial categories of Tourism-Oriented, Location-Neutral, Construction, and All Other (the annual average growth for each ranged between 2.6% and 3.8%).
During COVID-plus, though, there has been little growth in either Tourism-Oriented jobs – 3% total between 2019-2024 – or All Other jobs: 5% during the same time.
Instead, since COVID hit the vast majority of Jackson Hole’s job growth has been in Location-Neutral jobs – 26% growth since 2019 – and Construction: a whopping 41% in just five years. (Figure 4)

Wages
Why does the job mix matter? Because when it comes to local wages, Location-Neutral industries pay by far the highest wages. (Figure 5)

Here, too, things have changed dramatically since COVID: In 2019, the mean Location-Neutral wage was 50% higher than the mean Construction wage; in 2024, it was three times higher.
Why the big spike in Location-Neutral wages? Presumably, it was due to a COVID-driven influx of remote workers, ones whose jobs were more akin to those found in Silicon Valley than traditionally in Jackson Hole. This assumption is supported by the data, which show how wage patterns in Jackson Hole’s Location-Neutral jobs parallels the wage patterns in Silicon Valley. In fact, since 2019, Jackson Hole’s Location-Neutral wages have grown 50% faster than those of Silicon Valley. (Figure 6)

Payrolls
15 years ago, when Jackson Hole was entering into its recession-induced economic doldrums, only the most gifted visionary would have given much thought to parallels between Jackson Hole and Silicon Valley. Yet as with Silicon Valley, Teton County’s Location-Neutral industries now have the largest combined payroll of any economic sector in Jackson Hole. And it’s not even close. (Figure 7)

As a result, Location-Neutral has arguably become the most important economic sector in Jackson Hole.
Not in terms of total jobs or taxes paid or other contributions to the common weal. Instead, the Location-Neutral industry’s importance to Jackson Hole lies in the fact that it pays such high wages. As a result, it disproportionately influences who lives – and who can live – in Jackson Hole. In that sense, what we’re witnessing is Jackson Hole’s economy morphing from having a tourism-oriented sensibility to one increasingly akin to that of a tech or financial center.
Income
As profound as the shift has been from a Tourism-Oriented wage base to a Location-Neutral one, that pales in comparison to the most important fact shaping Jackson Hole’s socio-economic profile: The explosion in investment income. Investment income is the most location-neutral of all income types and, since 2009, Teton County residents’ combined investment income has gone from being 0.5 times greater than their combined wage income to today’s 3.5 times greater. (Figure 8)

Why does this matter? Because as Figure 9 suggests, for over 30 years there has been a clear and close correlation between Jackson Hole’s Total Income, Investment Income, and real estate prices. Which, even more than our shift towards Location-Neutral jobs, is profoundly shaping who can live in Jackson Hole. And, increasingly, beyond.

Affording Housing
In 2019, the year before COVID hit, the median price of a single-family home in Jackson Hole was $1.74 million. Five years later, it was twice that: $3.4 million. The median condominium price rose even more sharply: from $690,000 in 2019 to $2.2 million in 2024. (Figure 10)

By combining home prices with mortgage rates and making a couple of assumptions (that a buyer puts 20% down and that mortgage payments equal 1/3 of salary), we can calculate how much a prospective home buyer needs to earn in order to afford a given home.
Until 2017 the median single-family home was affordable to a household making a combined income of around $200,000. Even in 2018 and 2019, that figure was still no greater than $250,000.
Condos were, of course, much more affordable. In 2019, for example, a median-priced Jackson Hole condo was within reach of a household making $100,000. (Figure 11)

No mas. Since COVID hit, everything has changed. Between 2019-2024:
- Teton County’s mean wage rose 62%
- Teton County’s per capita investment income doubled
- Teton County’s median single-family home price doubled
- Teton County’s median condo price tripled.
As a result, in 2024 the price of the median free-market Jackson Hole condominium shot beyond the “affordable on two salaries” mark for even people working in Location-Neutral industries (the circled arrow in Figure 12). And for everyone else? As of 2024, even working five average full-time Jackson Hole jobs would not generate enough income to pay the mortgage on a median-priced Jackson Hole condominium. (Figure 12)
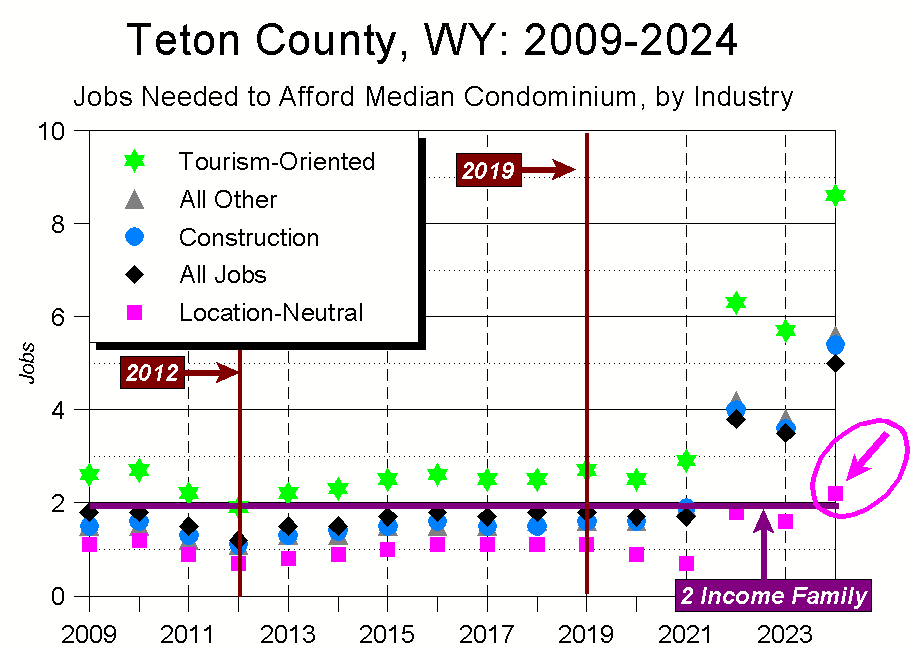
Where does that leave us? In a place where a Jackson Hole worker interested in buying a home and reliant solely on the sweat of their brow now has just two options: pursue deed-restricted housing in Jackson Hole proper, or look outside the valley to find a free market home they can afford.
Put more simply, in 2024 Jackson Hole’s housing market finally broke. After years of heading in that direction, in 2024 long-term trends and post-pandemic pressures combined to officially disconnect Jackson Hole’s housing market from the community’s wage base. And with it, the community’s workforce.
Discussion
So what to make of all this?
Six points seem germane.
1) The need for outside help
2024’s disconnect makes it clear that anyone looking to buy a free-market property in Teton County must have access to at least one of four financial resources:
- a remote job that pays far higher than standard Jackson Hole wages; and/or
- significant amounts of investment income; and/or
- significant amounts of savings; and/or
- help from family, friends, or other backers.
This is especially true because one of the assumptions I made is that the buyer could put 20% down. Do the math, and the downpayment comes out to a cool $440,000 for a median-priced condo and $680,000 for a median-priced single-family home.
2) The trend is clear
Given current socio-economic and demographic trends, it’s pretty clear where all this is going: towards an even more bifurcated haves/have-nots Jackson Hole. And, by extension, an even more bifurcated greater Tetons region.
Which is hard to imagine because Teton County is already the most income-unequal county in America. In particular, in 2022 (the most recent year for which data are available), the 20% of Teton County households which earned at least $200,000 in Adjusted Gross Income accounted for 91% of residents’ total income. These percentages ranked Teton County 18th and 1st, respectively, out of America’s 3,102 counties.
Also of note is that no other county comes close to Teton County’s wealth-unequalness: In Teton County, 91% of residents’ total income was earned by its wealthiest households; in no other county was the figure even 87% (Figure 13)
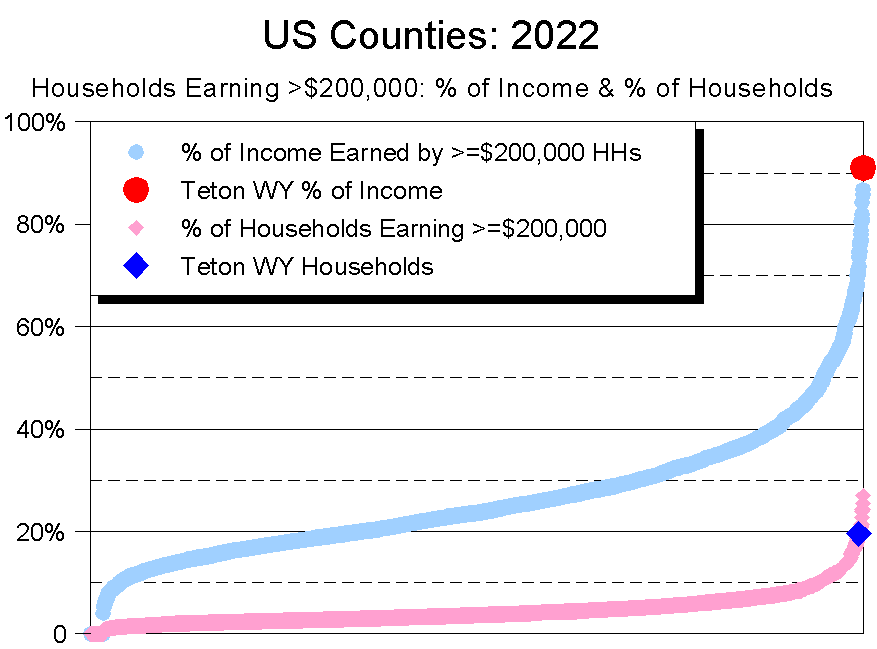
As more money comes into Teton County and more folks in the middle are forced out (or choose to leave), it will become increasingly difficult for anyone but the well-to-do to afford homes in Jackson Hole. This will not only further bifurcate the community, it will make us even more dependent on commuters.
3) No easy solution
“For every complex problem, there is an answer that is clear, simple, and wrong.”
– H.L. Mencken
Free-marketeers and affordable housing advocates seem to agree we can build our way out of our housing affordability problem. They’re wrong.
Why? Let’s start with the most basic economic principle: Supply and demand. Because Teton County ranks second in the nation in its percentage of public land, the easiest and most profitable thing to do with the county’s minuscule supply of private land is build high-end housing. Unleash market forces, and you’ll get a lot more ultra-luxe homes.
Similarly wrong is the shibboleth that loosening zoning and other housing-related regulations will address our housing problems. Nope.
Jackson Hole’s wealth is so great, its land so limited, and demand for housing so high that loosening or even eliminating regulations won’t make any meaningful difference. Not in building costs. Not in house prices. Not in the type of housing built.
What it would do is harm, if not destroy, many of the other qualities that shape our quality of life, including wildlife, views, relatively little traffic, and small-town feel.
Looking at the other side of the political divide, the question affordable housing advocates need to answer is even more elemental: “Where will the money come from to build all the affordable housing you want?”
Here again, it comes down to basic economics. Even if you can find the land (and the money to buy it), it still costs hundreds of thousands of dollars to subsidize every affordable housing unit. Where will that money come from? Not the private sector – again, the profit lies in high-end homes. Not the public sector – in hyper-libertarian Wyoming, local governments have few revenue-generating tools. And almost certainly not philanthropy – the sums involved are simply too big.
Unless an affordable housing advocate is addressing the issue’s economics, their efforts are simply performative.
4) Let’s be clear on what we’re doing
If we do subsidize housing, we’d better be sure we’re using that money well. Which, in turn, means we’d better be sure the housing we’re subsidizing is designed to meet not just today’s affordable housing needs, but those of the future.
This also means asking who we want to subsidize. When you get right down to it, affordable housing is a community’s way of addressing market failures; i.e., of helping facets of the community we care about but which need propping up. In some cases this means helping industries that can’t pay workers enough to afford housing; in others it means helping people who add to the community but can’t earn enough to otherwise live here.
To be clear, subsidizing things we care about is perfectly legitimate public policy. Given our mounting socio-economic pressures, though, what Jackson Hole now must address is a question we’ve never explicitly asked ourselves: “Who or what do we actually want to subsidize?” The clearer the answer, the more effective our efforts will be.
5) Long-term strategy
Subsidies are tactics. To meet the community’s goals, though, subsidies and other tactics must be nested within a long-term strategy; must help lead us towards a clear vision of our future. Unfortunately, for all our bounty we have no strategy regarding our future.
Theoretically, a strategy is embedded in the 2012 Comp Plan. To the extent it’s there, though, it’s gotten lost in the Plan’s focus on land use planning.
Rather than continue to ask the Comp Plan to do something it can’t or won’t do, we need to create a long-term strategic plan for the community. One that looks not just at land use, but at all the essential environmental, human, and economic issues embedded in the Comp Plan’s Vision Statement: “Preserve and protect the area’s ecosystem in order to ensure a healthy environment, community and economy for current and future generations.”
Absent such an effort, we can’t expect a different outcome: As the saying goes, doing the same thing over and over again and expecting different results is the definition of insanity.
6) Who decides?
To develop a successful strategic plan requires us to ask two additional questions, by far most difficult of them all: Who lives in Jackson Hole, and who makes that decision?
At its core, economics is about allocating scarce resources. When it comes to allocating housing – in other words, when it comes to deciding who can live in Jackson Hole – this community has relied on market forces to make that decision. So has our region, state, and nation.
Recently, a lot of concern has arisen about whether this approach is producing the kind of community we want. If we’re happy with where things are going, then great – our trajectory is clear and there’s little reason to think anything meaningful is going to change.
If we’re not happy with the direction we’re heading, though, then we need to start asking ourselves some difficult questions, beginning with the role market forces are playing in shaping Jackson Hole’s future. Ditto our embrace of growth.
These are extraordinarily difficult questions, especially because they require us to examine some fundamental beliefs about our economic and governance systems. But if we don’t like where things are heading, they’re questions that must be addressed.


